Your graphics add a nice touch to my presentations and I recently used them for one of my all-hands meetings. Your toolbox adds professionalism to my slides. Instead of using standard clipart.
Claude Jones, Director of Engineer, @Walmartlabs, USA
Your graphics add a nice touch to my presentations and I recently used them for one of my all-hands meetings. Your toolbox adds professionalism to my slides. Instead of using standard clipart.
Claude Jones, Director of Engineer, @Walmartlabs, USA
I needed a fresh look at some of my slides. I've tried to find a way to create a paintbrush effect, to underline, accentuate, add some color and the handwritten markers were just the things. Very easy to use, easy to size, change the color. It was an affordable, perfect solution and I'm happy to recommend it.
Anonymous, US
The crisp, clean look of the graphics, and the fact that it allowed me to easily edit and change the colors to match the template was my main reason for purchasing them.
Brandie Jenkins, E-learning Developer, USA
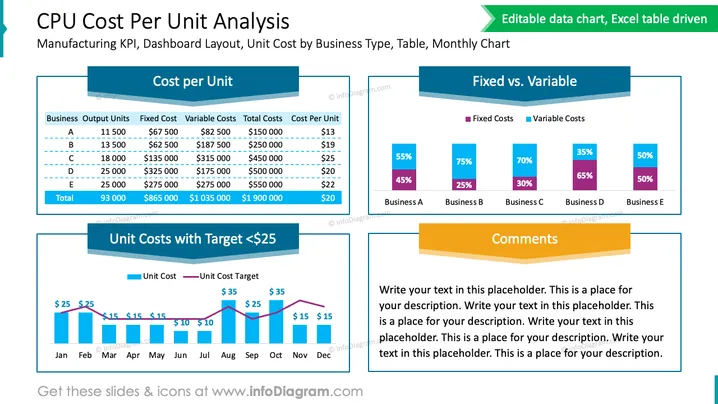
The slide titled "CPU Cost Per Unit Analysis" is structured with several graphical and textual components to reflect manufacturing key performance indicators (KPIs), a dashboard layout, and unit cost by business type. It includes a table summarizing output units, fixed costs, variable costs, total costs, and cost per unit for business types A through E. A bar chart depicts the unit costs with the target set at $25, while another bar chart compares fixed versus variable costs across businesses. A placeholder for comments is also available to add relevant notes.
The slide uses a clean layout and visually distinct sections to convey complex data in an easily digestible format. The contrast in colors and clear labeling aids in quick comprehension of the presented data.


