Your graphics add a nice touch to my presentations and I recently used them for one of my all-hands meetings. Your toolbox adds professionalism to my slides. Instead of using standard clipart.
Claude Jones, Director of Engineer, @Walmartlabs, USA
Your graphics add a nice touch to my presentations and I recently used them for one of my all-hands meetings. Your toolbox adds professionalism to my slides. Instead of using standard clipart.
Claude Jones, Director of Engineer, @Walmartlabs, USA
I needed a fresh look at some of my slides. I've tried to find a way to create a paintbrush effect, to underline, accentuate, add some color and the handwritten markers were just the things. Very easy to use, easy to size, change the color. It was an affordable, perfect solution and I'm happy to recommend it.
Anonymous, US
The crisp, clean look of the graphics, and the fact that it allowed me to easily edit and change the colors to match the template was my main reason for purchasing them.
Brandie Jenkins, E-learning Developer, USA
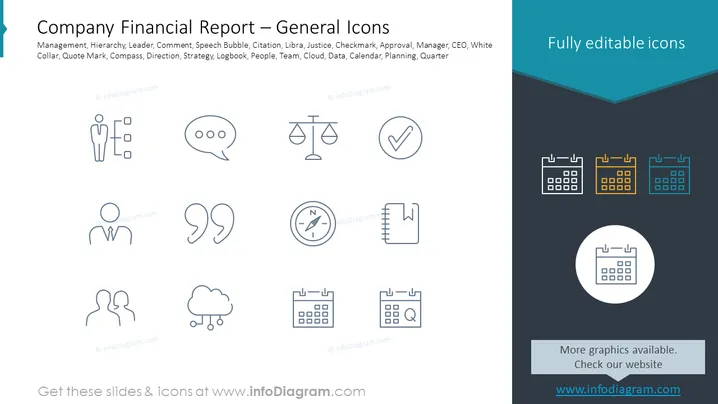
The slide titled "Company Financial Report – General Icons" presents a collection of twelve icons representing various concepts related to business and financial reporting. These include "Management," representing organizational structure; "Hierarchy," indicating the levels of authority; "Leader," symbolizing a guide or head; "Comment," for feedback or discussion; "Speech Bubble," indicating communication; "Citation," for referencing; "Libra," representing balance or justice; "Justice," for legal matters; "Checkmark," implying approval or completion; "Approval," for formal acceptance; "Manager," indicating a leadership role; "CEO," for the chief executive officer; "White Collar," representing professional roles; "Quote Mark," for highlighting speech; "Compass," suggesting direction or strategy; "Direction," for guidance or navigation; "Strategy," illustrating a plan of action; "Logbook," for record keeping; "People," symbolizing human resources or team; "Team," for collaborative working; "Cloud," signifying digital data storage; "Data," for information; "Calendar," indicating scheduling; "Planning," for organizing activities; and "Quarter," referring to fiscal periods.
The slide background is divided diagonally from the top right to the bottom left, with the top section in white and the lower section in dark blue.
There are twelve outline icons evenly distributed across three rows and four columns on the white background.
The icons are simple and monochrome, using a thin line style for visual consistency.
Each icon is accompanied by a small text label directly beneath it, describing the represented concept.
On the dark blue section, there are four calendar icons of different colors in a horizontal array, increasing the visual contrast.
The title of the slide is in a larger bold font and placed prominently at the top.
There is a prominent darker blue banner at the top-right corner that reads "Fully editable icons" in light blue text.
There is a light gray rectangle at the bottom with the text "More graphics available. Check our website" in a smaller font.
The overall design is clean and uses flat graphics, avoiding any clutter or unnecessary embellishments for a professional feel.
The slide has a professional and minimalist design with a focus on clarity and ease of interpretation.


