Your graphics add a nice touch to my presentations and I recently used them for one of my all-hands meetings. Your toolbox adds professionalism to my slides. Instead of using standard clipart.
Claude Jones, Director of Engineer, @Walmartlabs, USA
Your graphics add a nice touch to my presentations and I recently used them for one of my all-hands meetings. Your toolbox adds professionalism to my slides. Instead of using standard clipart.
Claude Jones, Director of Engineer, @Walmartlabs, USA
I needed a fresh look at some of my slides. I've tried to find a way to create a paintbrush effect, to underline, accentuate, add some color and the handwritten markers were just the things. Very easy to use, easy to size, change the color. It was an affordable, perfect solution and I'm happy to recommend it.
Anonymous, US
The crisp, clean look of the graphics, and the fact that it allowed me to easily edit and change the colors to match the template was my main reason for purchasing them.
Brandie Jenkins, E-learning Developer, USA
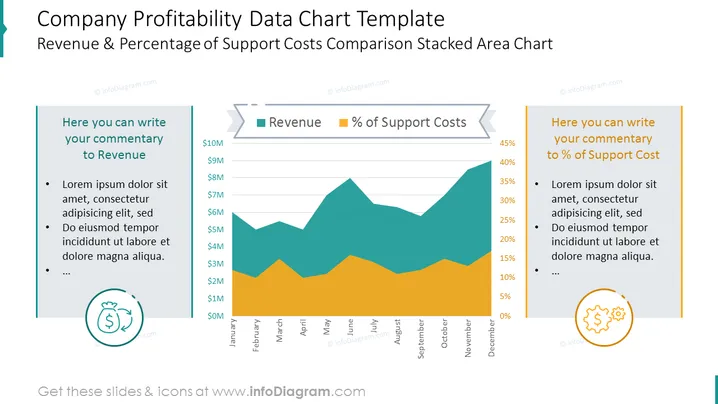
##Company Profitability Data Chart With Values and Description Layout
This is an Excel-driven PowerPoint Layout containing a stacked area chart presenting the revenue and percentage of support costs comparison along with commentary sections for both factors. It shows monthly money and percentage values against each other in a clear visual way.
##What Does This Company Profitability Data Chart With Values and Description Layout Include?
This Company Profitability Data Chart With Values and Description Layout is a part of our Company Finance Data Charts PPT Template.


