

Your graphics add a nice touch to my presentations and I recently used them for one of my all-hands meetings. Your toolbox adds professionalism to my slides. Instead of using standard clipart.
Claude Jones, Director of Engineer, @Walmartlabs, USA

Your graphics add a nice touch to my presentations and I recently used them for one of my all-hands meetings. Your toolbox adds professionalism to my slides. Instead of using standard clipart.
Claude Jones, Director of Engineer, @Walmartlabs, USA
I needed a fresh look at some of my slides. I've tried to find a way to create a paintbrush effect, to underline, accentuate, add some color and the handwritten markers were just the things. Very easy to use, easy to size, change the color. It was an affordable, perfect solution and I'm happy to recommend it.
Anonymous, US
The crisp, clean look of the graphics, and the fact that it allowed me to easily edit and change the colors to match the template was my main reason for purchasing them.
Brandie Jenkins, E-learning Developer, USA
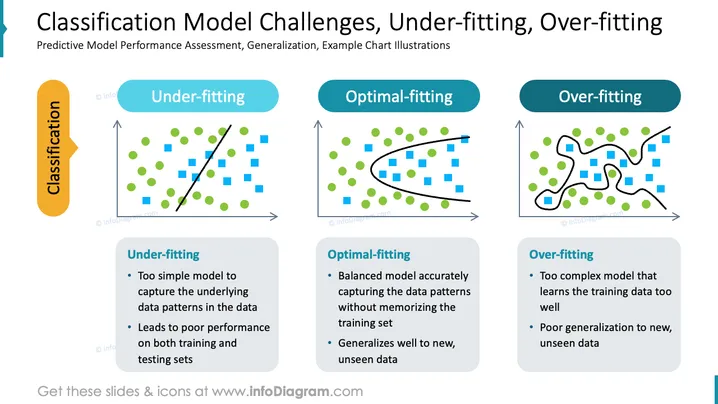
The PowerPoint slide is focused on the challenges of classification models in machine learning, emphasizing predictive model performance assessment and generalization with example chart illustrations. Under-fitting is described as a too simple model that fails to capture underlying data patterns, resulting in poor performance on training and testing datasets. Optimal-fitting represents a well-balanced model that accurately captures data patterns and generalizes effectively to new data. Over-fitting is characterized by a model that is too intricate, learning the training data excessively and failing to generalize to unfamiliar data.
The overall look of the slide is clean, well-organized, and uses visual aids like charts, color-coded banners, and bullet points to convey complex statistical concepts simply and effectively.



