Your graphics add a nice touch to my presentations and I recently used them for one of my all-hands meetings. Your toolbox adds professionalism to my slides. Instead of using standard clipart.
Claude Jones, Director of Engineer, @Walmartlabs, USA
Your graphics add a nice touch to my presentations and I recently used them for one of my all-hands meetings. Your toolbox adds professionalism to my slides. Instead of using standard clipart.
Claude Jones, Director of Engineer, @Walmartlabs, USA
I needed a fresh look at some of my slides. I've tried to find a way to create a paintbrush effect, to underline, accentuate, add some color and the handwritten markers were just the things. Very easy to use, easy to size, change the color. It was an affordable, perfect solution and I'm happy to recommend it.
Anonymous, US
The crisp, clean look of the graphics, and the fact that it allowed me to easily edit and change the colors to match the template was my main reason for purchasing them.
Brandie Jenkins, E-learning Developer, USA
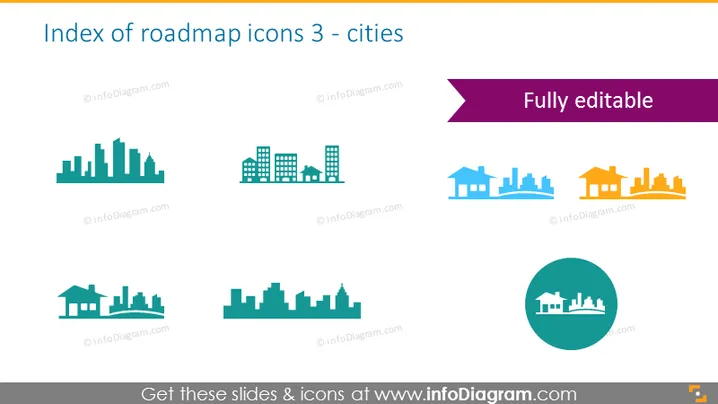
This PowerPoint slide titled 'Index of roadmap icons 3 - cities' provides an array of stylized icons representing various city and urban elements. These icons would typically be used in strategic planning presentations or project roadmaps to signify different urban-related milestones or aspects. The icons depict various building silhouettes such as classic cityscapes, residential areas, commercial buildings, industrial zones, and a circular icon with a waterfront city scene, presenting a versatile set of visual tools for urban planning or development themes.
The slide has a structured, grid-like layout with the icons neatly arranged in two rows. The choice of color and simple design of the icons make the slide visual appealing and easily understandable.


