Your graphics add a nice touch to my presentations and I recently used them for one of my all-hands meetings. Your toolbox adds professionalism to my slides. Instead of using standard clipart.
Claude Jones, Director of Engineer, @Walmartlabs, USA
Your graphics add a nice touch to my presentations and I recently used them for one of my all-hands meetings. Your toolbox adds professionalism to my slides. Instead of using standard clipart.
Claude Jones, Director of Engineer, @Walmartlabs, USA
I needed a fresh look at some of my slides. I've tried to find a way to create a paintbrush effect, to underline, accentuate, add some color and the handwritten markers were just the things. Very easy to use, easy to size, change the color. It was an affordable, perfect solution and I'm happy to recommend it.
Anonymous, US
The crisp, clean look of the graphics, and the fact that it allowed me to easily edit and change the colors to match the template was my main reason for purchasing them.
Brandie Jenkins, E-learning Developer, USA
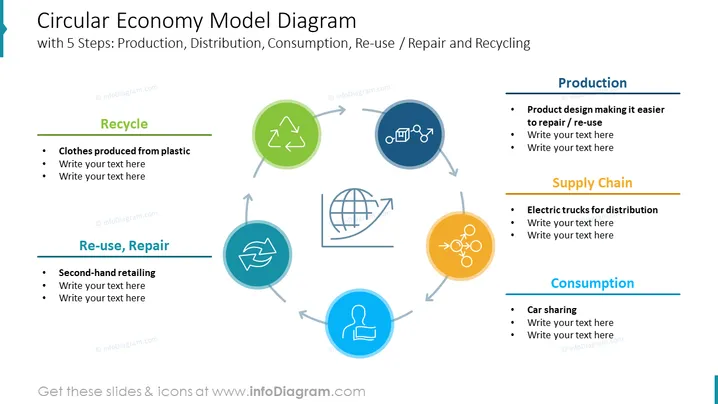
This PowerPoint slide effectively illustrates the concept of a circular economy, highlighting its five key stages: production, distribution, consumption, reuse/repair, and recycling. The slide can be incorporated into business presentations to emphasize the importance of sustainable practices and resource utilization. Its visually engaging infographic design makes it an impactful tool for educating audiences about the circular economy model.
A bold title that immediately captures attention and conveys the central theme of the slide.
This Circular Economy Model Diagram is a part of our Triple Bottom Line Sustainable Business Strategy PPT Template.


