Your graphics add a nice touch to my presentations and I recently used them for one of my all-hands meetings. Your toolbox adds professionalism to my slides. Instead of using standard clipart.
Claude Jones, Director of Engineer, @Walmartlabs, USA
Your graphics add a nice touch to my presentations and I recently used them for one of my all-hands meetings. Your toolbox adds professionalism to my slides. Instead of using standard clipart.
Claude Jones, Director of Engineer, @Walmartlabs, USA
I needed a fresh look at some of my slides. I've tried to find a way to create a paintbrush effect, to underline, accentuate, add some color and the handwritten markers were just the things. Very easy to use, easy to size, change the color. It was an affordable, perfect solution and I'm happy to recommend it.
Anonymous, US
The crisp, clean look of the graphics, and the fact that it allowed me to easily edit and change the colors to match the template was my main reason for purchasing them.
Brandie Jenkins, E-learning Developer, USA
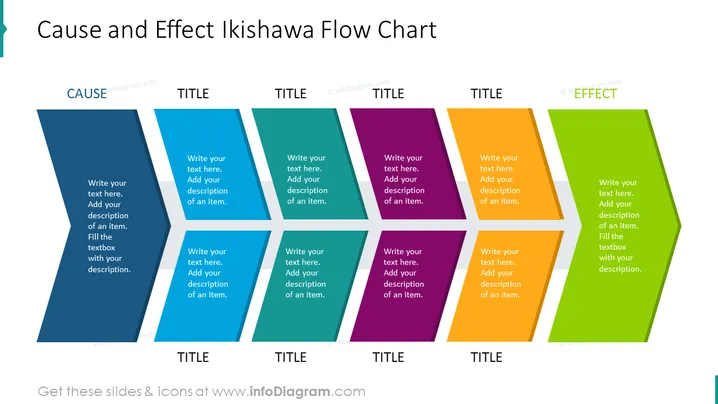
The slide is intended as a template for a Cause and Effect Ishikawa Flow Chart, also known as a fishbone diagram. It illustrates a linear cause-to-effect relationship with customizable sections for detailing various factors contributing to a single outcome. Each segment of the fishbone structure allows users to insert their text, aiding in a thorough explanation of each cause that leads to the effect outlined at the end of the sequence.
The slide presents a clean and organized visual hierarchy with ample negative space, making it easy to read. The gradual color transition adds a visual cue to follow the causality flow from the beginning (cause) to the end (effect).


