Your graphics add a nice touch to my presentations and I recently used them for one of my all-hands meetings. Your toolbox adds professionalism to my slides. Instead of using standard clipart.
Claude Jones, Director of Engineer, @Walmartlabs, USA
Your graphics add a nice touch to my presentations and I recently used them for one of my all-hands meetings. Your toolbox adds professionalism to my slides. Instead of using standard clipart.
Claude Jones, Director of Engineer, @Walmartlabs, USA
I needed a fresh look at some of my slides. I've tried to find a way to create a paintbrush effect, to underline, accentuate, add some color and the handwritten markers were just the things. Very easy to use, easy to size, change the color. It was an affordable, perfect solution and I'm happy to recommend it.
Anonymous, US
The crisp, clean look of the graphics, and the fact that it allowed me to easily edit and change the colors to match the template was my main reason for purchasing them.
Brandie Jenkins, E-learning Developer, USA
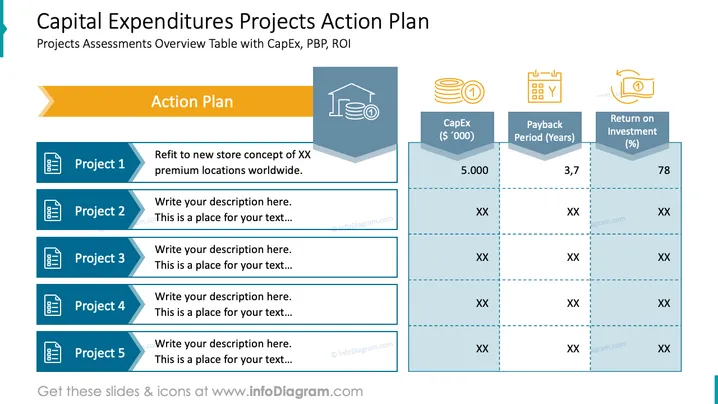
This slide is titled "Capital Expenditures Projects Action Plan" and is designed to outline and assess multiple projects based on financial metrics. "Project 1" is detailed as a refit to a new store concept of XX premium locations worldwide. Three metrics are provided: Capital Expenditure (CapEx) is at 5,000 ('000), Payback Period is 3.7 years, and Return on Investment (ROI) is 78%. Other projects (2 to 5) are placeholders for additional descriptions and respective financial metrics.
The overall slide is crisp and professional in appearance, with a visually balanced mix of icons, text, and color-coded elements to enhance readability and comprehension.


