Your graphics add a nice touch to my presentations and I recently used them for one of my all-hands meetings. Your toolbox adds professionalism to my slides. Instead of using standard clipart.
Claude Jones, Director of Engineer, @Walmartlabs, USA
Your graphics add a nice touch to my presentations and I recently used them for one of my all-hands meetings. Your toolbox adds professionalism to my slides. Instead of using standard clipart.
Claude Jones, Director of Engineer, @Walmartlabs, USA
I needed a fresh look at some of my slides. I've tried to find a way to create a paintbrush effect, to underline, accentuate, add some color and the handwritten markers were just the things. Very easy to use, easy to size, change the color. It was an affordable, perfect solution and I'm happy to recommend it.
Anonymous, US
The crisp, clean look of the graphics, and the fact that it allowed me to easily edit and change the colors to match the template was my main reason for purchasing them.
Brandie Jenkins, E-learning Developer, USA
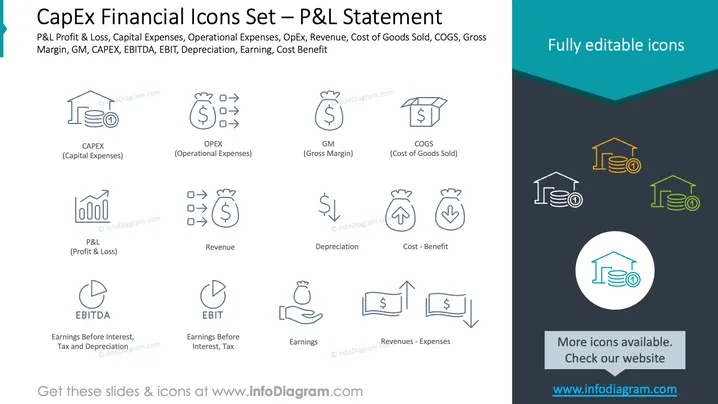
This slide introduces a set of financial icons related to the Profit & Loss Statement. It covers various concepts which include CAPEX (Capital Expenditures - funds used by a company to acquire or upgrade physical assets), OPEX (Operational Expenses - expenses required for the day-to-day functioning of the business), GM (Gross Margin - the difference between revenue and cost of goods sold), COGS (Cost of Goods Sold - the direct costs attributable to the production of the goods sold by a company), and other financial metrics like EBITDA (Earnings Before Interest, Taxes, Depreciation, and Amortization), EBIT (Earnings Before Interest and Taxes), Depreciation (the reduction in value of assets over time), and Cost-Benefit (a process of comparing the costs and benefits of a decision).
The slide has a professional and clean design with a strong visual hierarchy that emphasizes the icons and their associated labels. The monochromatic color scheme is consistent and focused, ensuring that the viewer is not distracted by color but instead can easily follow the content.
The slide is dedicated to financial terms associated with Profit & Loss statements, featuring icons and explanations for each term. CAPEX, or Capital Expenses, represent investment in assets that benefit a company long-term. OPEX denotes Operational Expenses that companies incur during their everyday operations. GM stands for Gross Margin, the profitability measure after accounting for the Cost of Goods Sold (COGS), which signifies the direct costs involved in producing goods. Other acronyms like EBITDA and EBIT reflect earnings before accounting for certain expenses, while metrics such as Depreciation and Cost-Benefit analyze asset value reduction and the balance between a decision's pros and cons.
The overall look of the slide is professional, with a clear focus on educating about financial concepts. The use of line drawings for icons and minimalist design ensures that the information is easily digestible.
The slide is titled "CapEx Financial Icons Set – P&L Statement" and offers a visual representation of key financial terms often used in profit and loss (P&L) analysis. CAPEX (Capital Expenditures) alludes to funds a company utilizes for acquiring or enhancing physical assets. OPEX (Operational Expenses) denotes ongoing costs for operating a business. GM (Gross Margin) indicates the difference between sales and the cost of goods sold (COGS), the latter representing direct costs tied to production. The slide further elucidates terms such as EBITDA (Earnings Before Interest, Taxes, Depreciation, and Amortization) and EBIT (Earnings Before Interest and Taxes), alongside presenting the concepts of depreciation, earnings, and the cost-benefit analysis involved in financial decisions.
The slide is streamlined and visually appealing, with a corporate style that prioritizes clarity and ease of understanding through uniform icon design and unobtrusive text elements.
The slide showcases a CapEx Financial Icons Set focused on the P&L Statement, including various financial elements such as CAPEX (Capital Expenses, which refer to major purchases a company makes towards its future growth), OPEX (Operational Expenses, the ongoing costs for running a company), GM (Gross Margin, the sales revenue minus cost of goods sold), and COGS (Cost of Goods Sold, representing the direct costs of goods production). It delves into advanced financial metrics like EBITDA (Earnings Before Interest, Taxes, Depreciation, and Amortization - a measure of a company's overall financial performance) and EBIT (Earnings Before Interest and Taxes - the net earnings of a company before interest and tax expenses are deducted), as well as concepts like Depreciation (asset value reduction over time due to use and wear), Earnings (the company's profit), and the importance of Cost-Benefit analysis (evaluating the benefit of a purchase against its cost).
The slide bears a professional, sleek design characterized by its modern icons and organized layout that visually encapsulates financial concepts in a comprehensible and accessible manner. The consistent ## CapEx Financial Icons Set – P&L Statement
The slide displays a CapEx Financial Icons Set that relates to a Profit & Loss (P&L) Statement, with elements such as CAPEX, or Capital Expenses, which are investments a company makes in itself to improve its future; OPEX, or Operational Expenses, which are costs associated with the business's day-to-day operations; GM, or Gross Margin, which is the revenue leftover after the Cost of Goods Sold (COGS) has been subtracted, illustrating the profitability of the items being sold; Other icons represent critical financial metrics like EBITDA (Earnings Before Interest, Taxes, Depreciation, and Amortization) and EBIT (Earnings Before Interest and Taxes), along with Depreciation, which is the gradual loss of an asset's value, Earnings, and the concept of weighing Cost against Benefit in financial decisions.
The slide is designed with a professional and contemporary aesthetic. The icons are uniform, creating a harmonious and informative display with a clear message portraying financial concepts without visual clutter.
The slide introduces icons representing essential concepts for the P&L statement analysis, including CAPEX (capital investments for long-term benefits), OPEX (daily operational costs), GM (profitability after deducting the cost of goods sold, known as COGS), EBITDA (profits before deducting interest, taxes, and depreciation), EBIT (profits before interest and taxes), along with symbols for depreciation, earnings, and cost-benefit assessments.
The slide is clean and straightforward, with an emphasis on visual learning through well-defined icons and accompanying text, presented in a professional and visually appealing layout.


