Your graphics add a nice touch to my presentations and I recently used them for one of my all-hands meetings. Your toolbox adds professionalism to my slides. Instead of using standard clipart.
Claude Jones, Director of Engineer, @Walmartlabs, USA
Your graphics add a nice touch to my presentations and I recently used them for one of my all-hands meetings. Your toolbox adds professionalism to my slides. Instead of using standard clipart.
Claude Jones, Director of Engineer, @Walmartlabs, USA
I needed a fresh look at some of my slides. I've tried to find a way to create a paintbrush effect, to underline, accentuate, add some color and the handwritten markers were just the things. Very easy to use, easy to size, change the color. It was an affordable, perfect solution and I'm happy to recommend it.
Anonymous, US
The crisp, clean look of the graphics, and the fact that it allowed me to easily edit and change the colors to match the template was my main reason for purchasing them.
Brandie Jenkins, E-learning Developer, USA
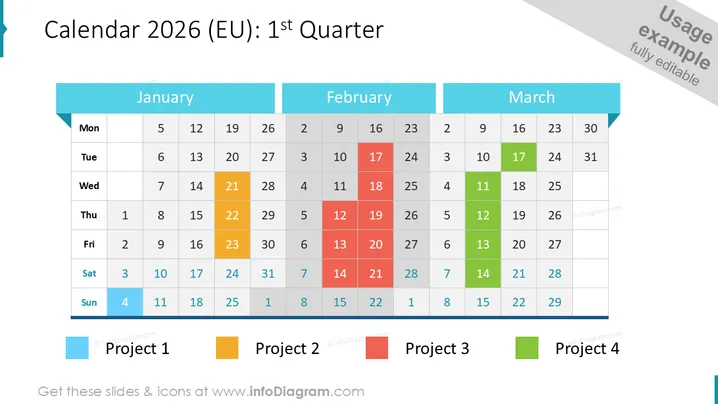
The slide is a visual representation of the Calendar for the first quarter of 2025, specific to the European region. It showcases the months January, February, and March laid out in a traditional grid structure. Each month is color-coded to highlight different days associated with four distinct projects. For instance, Project 1 is highlighted in blue, Project 2 in yellow, Project 3 in red, and Project 4 in green. This color coding provides a clear visual differentiation between the days dedicated to different projects.
The slide has a professional and straightforward aesthetic, with a strong emphasis on clarity and organization through the use of color coding. The layout is grid-based, symmetric, and spacious, which contributes to a sense of order and readability.


