Your graphics add a nice touch to my presentations and I recently used them for one of my all-hands meetings. Your toolbox adds professionalism to my slides. Instead of using standard clipart.
Claude Jones, Director of Engineer, @Walmartlabs, USA
Your graphics add a nice touch to my presentations and I recently used them for one of my all-hands meetings. Your toolbox adds professionalism to my slides. Instead of using standard clipart.
Claude Jones, Director of Engineer, @Walmartlabs, USA
I needed a fresh look at some of my slides. I've tried to find a way to create a paintbrush effect, to underline, accentuate, add some color and the handwritten markers were just the things. Very easy to use, easy to size, change the color. It was an affordable, perfect solution and I'm happy to recommend it.
Anonymous, US
The crisp, clean look of the graphics, and the fact that it allowed me to easily edit and change the colors to match the template was my main reason for purchasing them.
Brandie Jenkins, E-learning Developer, USA
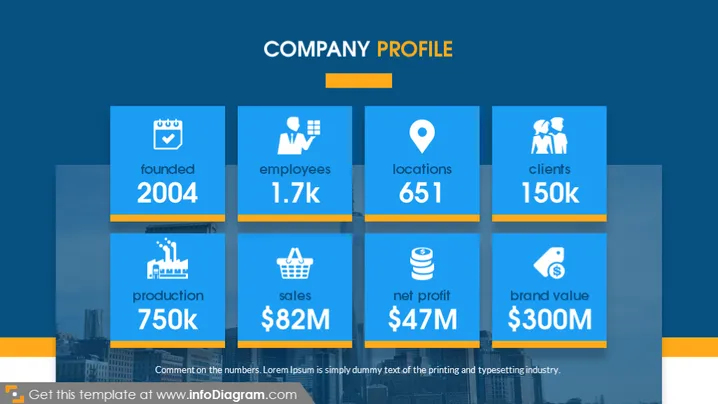
The slide presents a "Company Profile" with key metrics that highlight the company's size and performance. Key statistics include "founded 2004," denoting the company’s establishment year; "employees 1.7k," indicating the size of the workforce; "locations 651," showing the extent of the company's physical presence; "clients 150k," reflecting the customer base; "production 750k," presumably a measure of output; "sales $82M," representing revenue; "net profit $47M," showcasing profitability; and "brand value $300M," implying the financial worth of the brand. The numbers appear to be placeholders, illustrating the types of metrics that might be included in such a slide.
The slide uses a professional color scheme of blue tones with orange accents, conveying a corporate mood. The icons are simple and easily recognizable, aiding in the quick comprehension of each accompanied metric.


