Your graphics add a nice touch to my presentations and I recently used them for one of my all-hands meetings. Your toolbox adds professionalism to my slides. Instead of using standard clipart.
Claude Jones, Director of Engineer, @Walmartlabs, USA
Your graphics add a nice touch to my presentations and I recently used them for one of my all-hands meetings. Your toolbox adds professionalism to my slides. Instead of using standard clipart.
Claude Jones, Director of Engineer, @Walmartlabs, USA
I needed a fresh look at some of my slides. I've tried to find a way to create a paintbrush effect, to underline, accentuate, add some color and the handwritten markers were just the things. Very easy to use, easy to size, change the color. It was an affordable, perfect solution and I'm happy to recommend it.
Anonymous, US
The crisp, clean look of the graphics, and the fact that it allowed me to easily edit and change the colors to match the template was my main reason for purchasing them.
Brandie Jenkins, E-learning Developer, USA
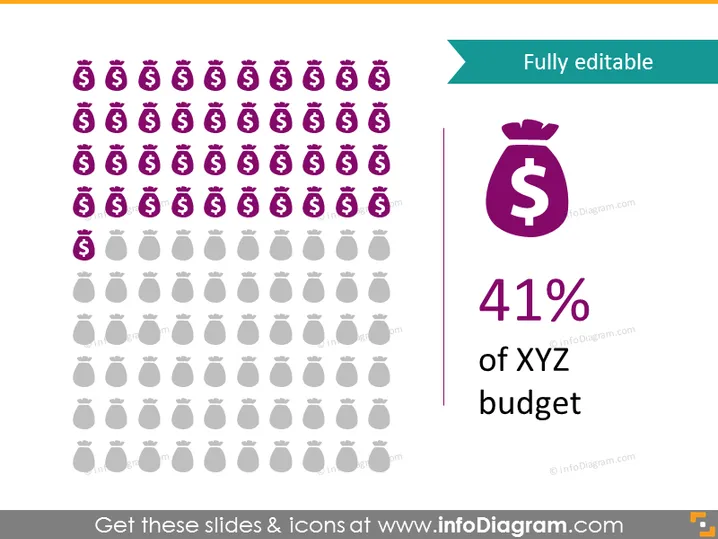
The PowerPoint slide presents a visual representation of budget allocation, with the title "Fully editable." It is presumably used to demonstrate a portion of a budget dedicated to a specific area, denoted as "41% of XYZ budget." The conceptual emphasis seems to be on the modifiable nature of the slide, suggesting the information can be tailored to the presenter's needs. A matrix of money bag icons proportionally illustrates the 41% figure, conveying the idea that nearly half of the resources are allocated to 'XYZ.'
The slide uses color contrasts and proportional iconography to create a visual representation of budget allocation. The overall design is modern and professional, ideal for business or financial presentations.


