Your graphics add a nice touch to my presentations and I recently used them for one of my all-hands meetings. Your toolbox adds professionalism to my slides. Instead of using standard clipart.
Claude Jones, Director of Engineer, @Walmartlabs, USA
Your graphics add a nice touch to my presentations and I recently used them for one of my all-hands meetings. Your toolbox adds professionalism to my slides. Instead of using standard clipart.
Claude Jones, Director of Engineer, @Walmartlabs, USA
I needed a fresh look at some of my slides. I've tried to find a way to create a paintbrush effect, to underline, accentuate, add some color and the handwritten markers were just the things. Very easy to use, easy to size, change the color. It was an affordable, perfect solution and I'm happy to recommend it.
Anonymous, US
The crisp, clean look of the graphics, and the fact that it allowed me to easily edit and change the colors to match the template was my main reason for purchasing them.
Brandie Jenkins, E-learning Developer, USA
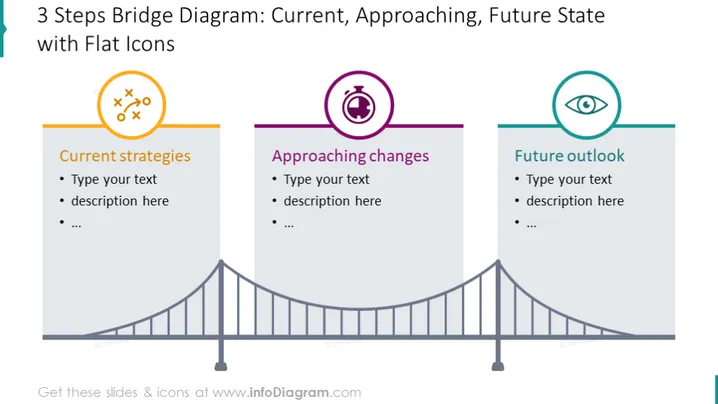
The PowerPoint slide presents a bridge diagram divided into three sections to represent different stages. The first section, "Current strategies," suggests a focus on present plans or operations, potentially detailing existing methods or policies. The second section, "Approaching changes," implies a transition phase, hinting at modifications or adaptions likely undergoing consideration. The final section, "Future outlook," points toward long-term visions or goals, perhaps outlining projected developments or targets.
The slide sports a clean and modern design with colorful flat icons and a clear separation of stages symbolized by the bridge. The use of distinct colors for each section effectively segments the information and guides the viewer through a timeline from present to future.


