Your graphics add a nice touch to my presentations and I recently used them for one of my all-hands meetings. Your toolbox adds professionalism to my slides. Instead of using standard clipart.
Claude Jones, Director of Engineer, @Walmartlabs, USA
Your graphics add a nice touch to my presentations and I recently used them for one of my all-hands meetings. Your toolbox adds professionalism to my slides. Instead of using standard clipart.
Claude Jones, Director of Engineer, @Walmartlabs, USA
I needed a fresh look at some of my slides. I've tried to find a way to create a paintbrush effect, to underline, accentuate, add some color and the handwritten markers were just the things. Very easy to use, easy to size, change the color. It was an affordable, perfect solution and I'm happy to recommend it.
Anonymous, US
The crisp, clean look of the graphics, and the fact that it allowed me to easily edit and change the colors to match the template was my main reason for purchasing them.
Brandie Jenkins, E-learning Developer, USA
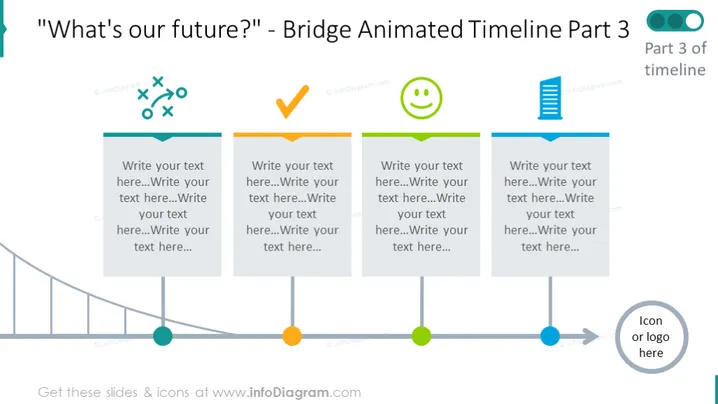
The slide titled "What's our future? - Bridge Animated Timeline Part 3" appears to represent the third part of a business timeline, showcasing future planning or projecting events. There are four key points on the timeline, each signified by a distinct colored circular icon and an associated rectangular text box. Each text box is prepared for the insertion of detailed information about different stages or events in a company's future strategy. The slide implies sequential progression and potential milestone achievements.
The overall look of the slide is modern and professional, with a playful touch added by the use of bright colors and icons. The design is visually engaging, drawing the viewer's eye along the timeline in a natural progression from left to right.


