

Your graphics add a nice touch to my presentations and I recently used them for one of my all-hands meetings. Your toolbox adds professionalism to my slides. Instead of using standard clipart.
Claude Jones, Director of Engineer, @Walmartlabs, USA

Your graphics add a nice touch to my presentations and I recently used them for one of my all-hands meetings. Your toolbox adds professionalism to my slides. Instead of using standard clipart.
Claude Jones, Director of Engineer, @Walmartlabs, USA
I needed a fresh look at some of my slides. I've tried to find a way to create a paintbrush effect, to underline, accentuate, add some color and the handwritten markers were just the things. Very easy to use, easy to size, change the color. It was an affordable, perfect solution and I'm happy to recommend it.
Anonymous, US
The crisp, clean look of the graphics, and the fact that it allowed me to easily edit and change the colors to match the template was my main reason for purchasing them.
Brandie Jenkins, E-learning Developer, USA
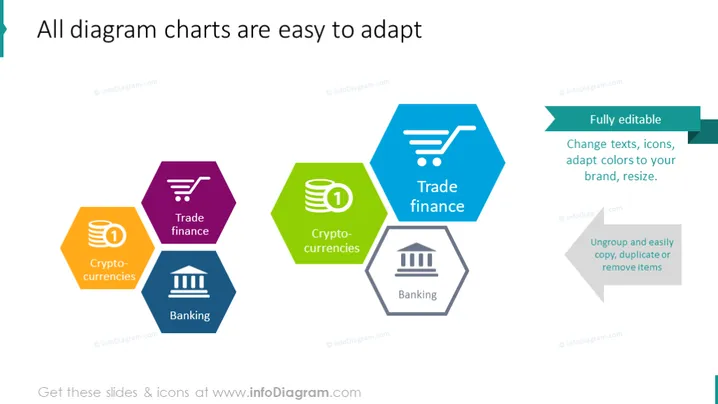
The PowerPoint slide is primarily concerned with showing the adaptability of diagram charts. It lists different financial sectors such as "Cryptocurrencies," "Trade finance," and "Banking," each represented by a distinctive hexagonal icon. "Cryptocurrencies" is associated with dynamic changes, hinting at innovation and investment opportunities. "Trade finance" suggests a focus on the economic activities that fund and facilitate commerce and international trading. "Banking" is likely tied to the financial institutions that manage deposits, offer loans, and provide other financial services.
The overall look of the slide is clean and modern, with a strong visual alignment of elements. The use of colors and bold icons facilitates quick comprehension of the individual financial concepts being presented.



