Your graphics add a nice touch to my presentations and I recently used them for one of my all-hands meetings. Your toolbox adds professionalism to my slides. Instead of using standard clipart.
Claude Jones, Director of Engineer, @Walmartlabs, USA
Your graphics add a nice touch to my presentations and I recently used them for one of my all-hands meetings. Your toolbox adds professionalism to my slides. Instead of using standard clipart.
Claude Jones, Director of Engineer, @Walmartlabs, USA
I needed a fresh look at some of my slides. I've tried to find a way to create a paintbrush effect, to underline, accentuate, add some color and the handwritten markers were just the things. Very easy to use, easy to size, change the color. It was an affordable, perfect solution and I'm happy to recommend it.
Anonymous, US
The crisp, clean look of the graphics, and the fact that it allowed me to easily edit and change the colors to match the template was my main reason for purchasing them.
Brandie Jenkins, E-learning Developer, USA
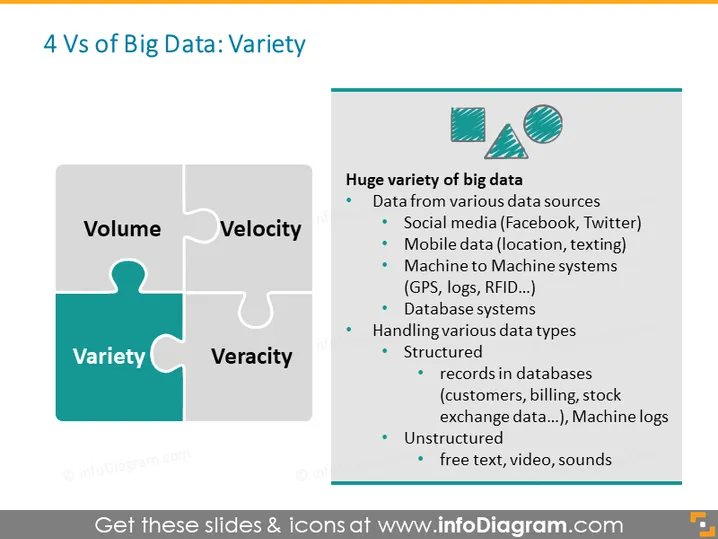
The slide focuses on "Variety," one of the four dimensions of Big Data, often called the 4 Vs. It explains that the variety in Big Data comes from numerous data sources like social media, mobile data, machine-to-machine systems, and database systems. It indicates there are different data types—structured, which includes records in databases like customer and billing information, stock exchange data, and machine logs; and unstructured, like free text, videos, and sounds, highlighting the diverse forms that Big Data can take.
The slide has a clean and professional design with a grey and teal color scheme. The use of puzzle pieces effectively represents the concept of interconnected components of Big Data.


