Your graphics add a nice touch to my presentations and I recently used them for one of my all-hands meetings. Your toolbox adds professionalism to my slides. Instead of using standard clipart.
Claude Jones, Director of Engineer, @Walmartlabs, USA
Your graphics add a nice touch to my presentations and I recently used them for one of my all-hands meetings. Your toolbox adds professionalism to my slides. Instead of using standard clipart.
Claude Jones, Director of Engineer, @Walmartlabs, USA
I needed a fresh look at some of my slides. I've tried to find a way to create a paintbrush effect, to underline, accentuate, add some color and the handwritten markers were just the things. Very easy to use, easy to size, change the color. It was an affordable, perfect solution and I'm happy to recommend it.
Anonymous, US
The crisp, clean look of the graphics, and the fact that it allowed me to easily edit and change the colors to match the template was my main reason for purchasing them.
Brandie Jenkins, E-learning Developer, USA
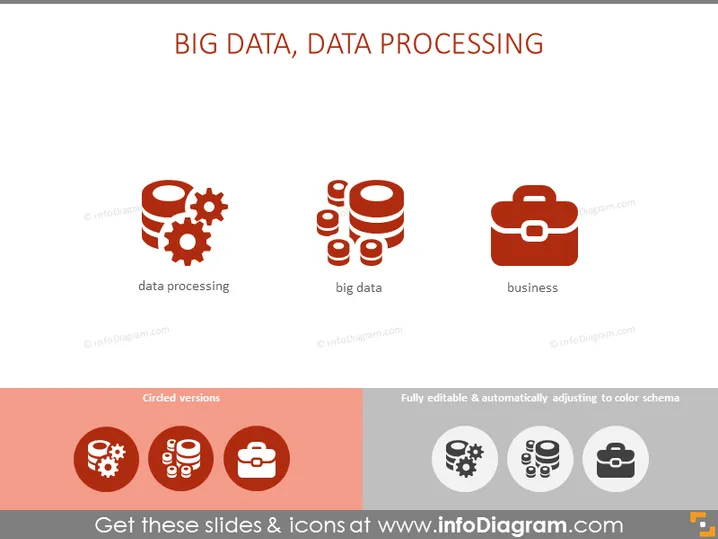
The slide is focused on three key concepts related to data management: data processing, big data, and business. Data processing refers to the collection and manipulation of items of data to produce meaningful information. Big data involves handling and analyzing data sets that are too large or complex for traditional data-processing software. Business is likely related to the commercial context in which these data processes are applied, highlighting the importance of data in the business decision-making process.
The slide presents a clean and professional design. The use of colors and simple icons facilitates an immediate understanding of the concepts related to data management and business.


