Your graphics add a nice touch to my presentations and I recently used them for one of my all-hands meetings. Your toolbox adds professionalism to my slides. Instead of using standard clipart.
Claude Jones, Director of Engineer, @Walmartlabs, USA
Your graphics add a nice touch to my presentations and I recently used them for one of my all-hands meetings. Your toolbox adds professionalism to my slides. Instead of using standard clipart.
Claude Jones, Director of Engineer, @Walmartlabs, USA
I needed a fresh look at some of my slides. I've tried to find a way to create a paintbrush effect, to underline, accentuate, add some color and the handwritten markers were just the things. Very easy to use, easy to size, change the color. It was an affordable, perfect solution and I'm happy to recommend it.
Anonymous, US
The crisp, clean look of the graphics, and the fact that it allowed me to easily edit and change the colors to match the template was my main reason for purchasing them.
Brandie Jenkins, E-learning Developer, USA
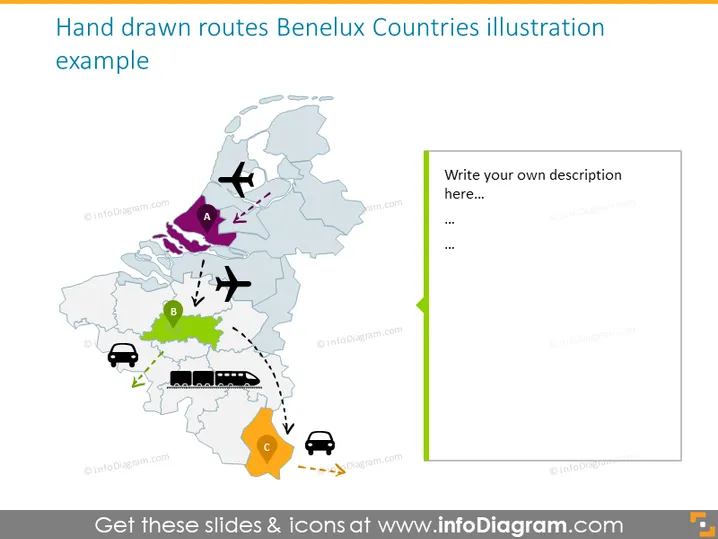
This PowerPoint slide is titled "Hand drawn routes Benelux Countries illustration" and seems to be illustrating potential routes or connections within the Benelux region, which includes Belgium, the Netherlands, and Luxembourg. Each country is marked with a letter—A for the northern country, B for the central, and C for the southern country—along with corresponding icons like planes, cars, and cargo trucks, indicating different modes of transportation.
The slide has a clean and appealing look with a balance of visual elements and space for text. The hand-drawn stylization lends a sense of informality and approachability to the presentation of the data.


