Your graphics add a nice touch to my presentations and I recently used them for one of my all-hands meetings. Your toolbox adds professionalism to my slides. Instead of using standard clipart.
Claude Jones, Director of Engineer, @Walmartlabs, USA
Your graphics add a nice touch to my presentations and I recently used them for one of my all-hands meetings. Your toolbox adds professionalism to my slides. Instead of using standard clipart.
Claude Jones, Director of Engineer, @Walmartlabs, USA
I needed a fresh look at some of my slides. I've tried to find a way to create a paintbrush effect, to underline, accentuate, add some color and the handwritten markers were just the things. Very easy to use, easy to size, change the color. It was an affordable, perfect solution and I'm happy to recommend it.
Anonymous, US
The crisp, clean look of the graphics, and the fact that it allowed me to easily edit and change the colors to match the template was my main reason for purchasing them.
Brandie Jenkins, E-learning Developer, USA
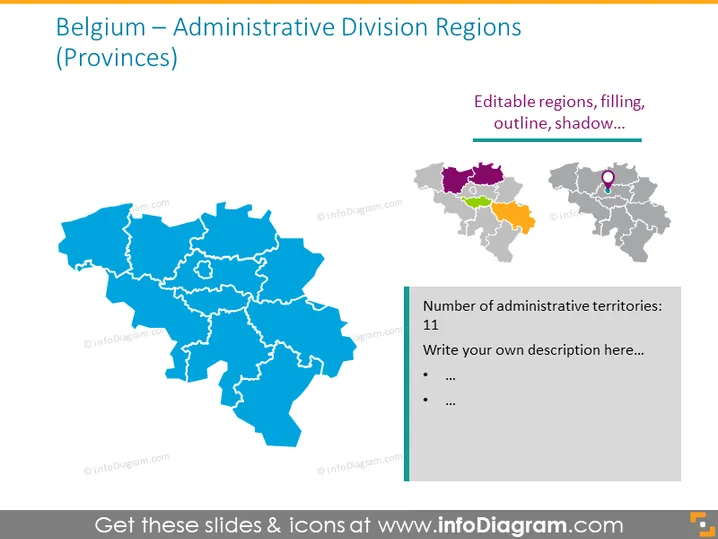
The slide presents a map of Belgium, delineating its administrative division into provinces. Aside from the primary blue-colored map, there are two smaller maps with provinces highlighted in different colors and a location pin icon, indicating the capability of editing regions and customizing visual elements. A side note specifies "Editable regions, filling, outline, shadow..." to emphasize the customization options. Another text box states there are "Number of administrative territories: 11" and prompts the user to "Write your own description here..." with bullet points for additional information.
The slide has a professionally clean and minimalistic design. The use of contrasting colors for the main map and the information boxes ensures a clear distinction between graphic elements and textual information.


