Your graphics add a nice touch to my presentations and I recently used them for one of my all-hands meetings. Your toolbox adds professionalism to my slides. Instead of using standard clipart.
Claude Jones, Director of Engineer, @Walmartlabs, USA
Your graphics add a nice touch to my presentations and I recently used them for one of my all-hands meetings. Your toolbox adds professionalism to my slides. Instead of using standard clipart.
Claude Jones, Director of Engineer, @Walmartlabs, USA
I needed a fresh look at some of my slides. I've tried to find a way to create a paintbrush effect, to underline, accentuate, add some color and the handwritten markers were just the things. Very easy to use, easy to size, change the color. It was an affordable, perfect solution and I'm happy to recommend it.
Anonymous, US
The crisp, clean look of the graphics, and the fact that it allowed me to easily edit and change the colors to match the template was my main reason for purchasing them.
Brandie Jenkins, E-learning Developer, USA
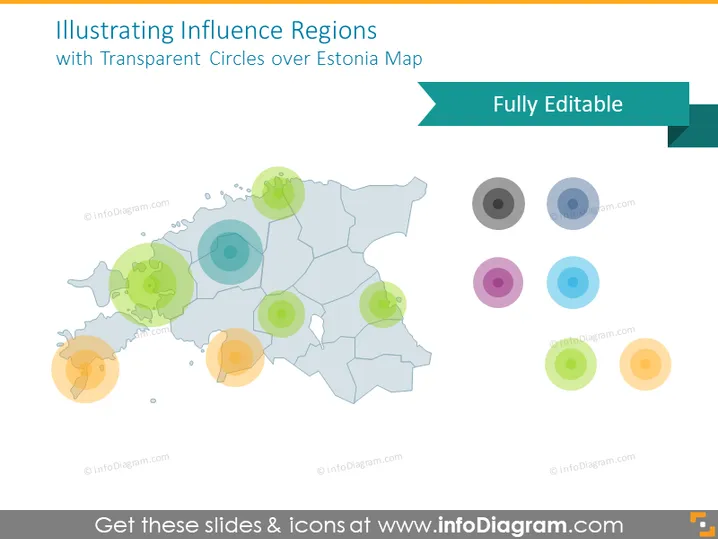
The PowerPoint slide presents the concept of influence regions using a map of Estonia as a base and overlaying transparent colored circles to denote various zones of influence or impact. The slide title indicates that these regions are illustrated to potentially assist with a geographical analysis or strategic planning involving influence across different areas of Estonia. Such visual tools can serve in assessing market penetration, the spread of social phenomena, or resource allocation across regions.
The overall aesthetic is modern and professional, with an emphasis on visual clarity. The use of transparent colors aids in pointing out overlapping regions without obscuring the map details.


