Your graphics add a nice touch to my presentations and I recently used them for one of my all-hands meetings. Your toolbox adds professionalism to my slides. Instead of using standard clipart.
Claude Jones, Director of Engineer, @Walmartlabs, USA
Your graphics add a nice touch to my presentations and I recently used them for one of my all-hands meetings. Your toolbox adds professionalism to my slides. Instead of using standard clipart.
Claude Jones, Director of Engineer, @Walmartlabs, USA
I needed a fresh look at some of my slides. I've tried to find a way to create a paintbrush effect, to underline, accentuate, add some color and the handwritten markers were just the things. Very easy to use, easy to size, change the color. It was an affordable, perfect solution and I'm happy to recommend it.
Anonymous, US
The crisp, clean look of the graphics, and the fact that it allowed me to easily edit and change the colors to match the template was my main reason for purchasing them.
Brandie Jenkins, E-learning Developer, USA
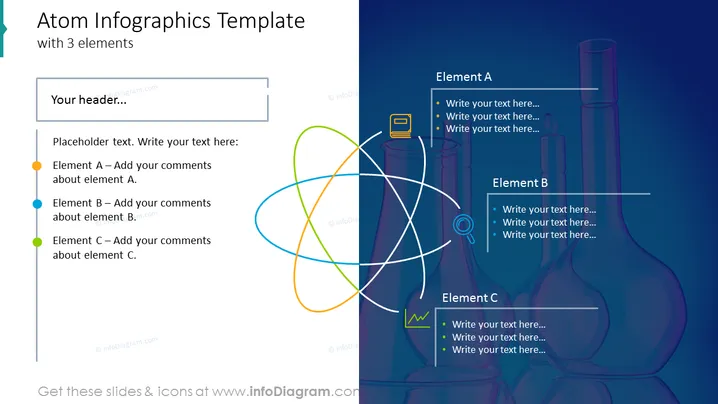
This PowerPoint slide titled 'Atom Infographics Template with 3 elements' is designed for presenting interconnected topics. It suggests a central idea or system with three significant components: Element A, Element B, and Element C, each for adding specific comments. This can represent a concept where three distinct aspects contribute to the overarching subject or interact with each other within a framework, system, or process.
The slide is visually balanced, with text elements on the left and an attention-grabbing, colorful, atomic diagram on the right. The graphical elements underpin the template's conceptual message of interconnected components within a single system.


