Your graphics add a nice touch to my presentations and I recently used them for one of my all-hands meetings. Your toolbox adds professionalism to my slides. Instead of using standard clipart.
Claude Jones, Director of Engineer, @Walmartlabs, USA
Your graphics add a nice touch to my presentations and I recently used them for one of my all-hands meetings. Your toolbox adds professionalism to my slides. Instead of using standard clipart.
Claude Jones, Director of Engineer, @Walmartlabs, USA
I needed a fresh look at some of my slides. I've tried to find a way to create a paintbrush effect, to underline, accentuate, add some color and the handwritten markers were just the things. Very easy to use, easy to size, change the color. It was an affordable, perfect solution and I'm happy to recommend it.
Anonymous, US
The crisp, clean look of the graphics, and the fact that it allowed me to easily edit and change the colors to match the template was my main reason for purchasing them.
Brandie Jenkins, E-learning Developer, USA
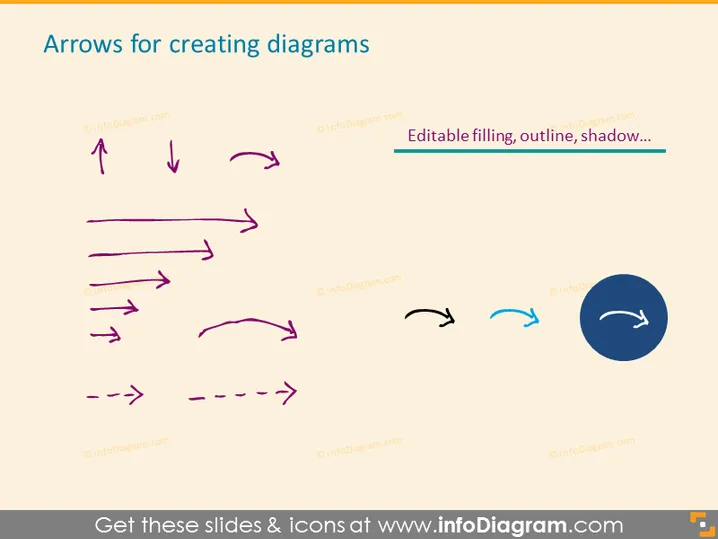
The slide is titled "Arrows for creating diagrams" and features a collection of arrow shapes of varying styles. These include straight arrows pointing upward, downward, and to the right, bent and curved arrows indicating change in direction or process flow, and dashed arrows that suggest a less direct or non-continuous process. The text mentions "Editable filling, outline, shadow..." which implies that the arrow graphics are customizable for the user's specific needs in creating diagrams.
The slide has a minimal and professional design with a balanced use of space. The variety of arrow shapes and colors makes it visually engaging without being overwhelming.


