Your graphics add a nice touch to my presentations and I recently used them for one of my all-hands meetings. Your toolbox adds professionalism to my slides. Instead of using standard clipart.
Claude Jones, Director of Engineer, @Walmartlabs, USA
Your graphics add a nice touch to my presentations and I recently used them for one of my all-hands meetings. Your toolbox adds professionalism to my slides. Instead of using standard clipart.
Claude Jones, Director of Engineer, @Walmartlabs, USA
I needed a fresh look at some of my slides. I've tried to find a way to create a paintbrush effect, to underline, accentuate, add some color and the handwritten markers were just the things. Very easy to use, easy to size, change the color. It was an affordable, perfect solution and I'm happy to recommend it.
Anonymous, US
The crisp, clean look of the graphics, and the fact that it allowed me to easily edit and change the colors to match the template was my main reason for purchasing them.
Brandie Jenkins, E-learning Developer, USA
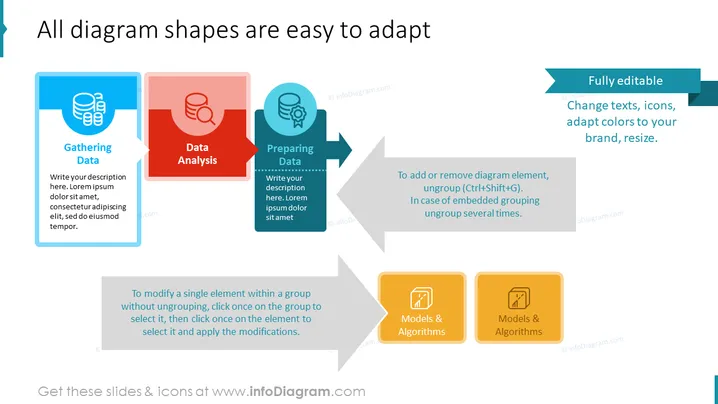
The slide outlines a process flow beginning with "Gathering Data," followed by "Data Analysis" and "Preparing Data," and finally transitioning to the concepts of "Models & Algorithms." Each phase is denoted by a colored rectangle with a corresponding icon and space for a description, indicating a step in a larger workflow typically found in data processing or project planning contexts. The note at the bottom suggests that each element of the diagram is customizable without ungrouping, which emphasizes the ease of adaptation for the presenter's needs.
The slide utilizes contrasting colors and icons to differentiate between stages in a process. It maintains a professional yet dynamic appearance with the use of bold directional arrows indicating flow and interconnectivity.


