
Your graphics add a nice touch to my presentations and I recently used them for one of my all-hands meetings. Your toolbox adds professionalism to my slides. Instead of using standard clipart.
Claude Jones, Director of Engineer, @Walmartlabs, USA
Your graphics add a nice touch to my presentations and I recently used them for one of my all-hands meetings. Your toolbox adds professionalism to my slides. Instead of using standard clipart.
Claude Jones, Director of Engineer, @Walmartlabs, USA
I needed a fresh look at some of my slides. I've tried to find a way to create a paintbrush effect, to underline, accentuate, add some color and the handwritten markers were just the things. Very easy to use, easy to size, change the color. It was an affordable, perfect solution and I'm happy to recommend it.
Anonymous, US
The crisp, clean look of the graphics, and the fact that it allowed me to easily edit and change the colors to match the template was my main reason for purchasing them.
Brandie Jenkins, E-learning Developer, USA
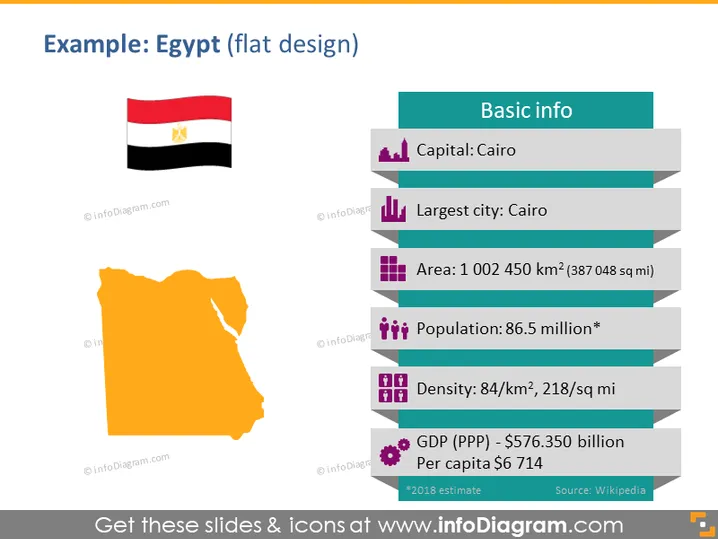
The PowerPoint slide is titled "Example: Egypt (flat design)" and provides basic information about Egypt in a clear and structured manner. The capital is stated as Cairo, which is also the largest city. The area of Egypt is given as 1,002,450 square kilometers. The population is listed as 86.5 million, suggesting this figure is an estimate with the asterisk. Population density is provided as 84 per square kilometer. Furthermore, the Gross Domestic Product (GDP) based on Purchasing Power Parity (PPP) is $576.350 billion, with a per capita GDP of $6,714, referencing 2018 estimates and citing Wikipedia as the source.
The slide has a modern and colorful flat design with easily discernible elements that are well organized. The use of icons next to each data point helps in quickly identifying the type of information presented.




