Your graphics add a nice touch to my presentations and I recently used them for one of my all-hands meetings. Your toolbox adds professionalism to my slides. Instead of using standard clipart.
Claude Jones, Director of Engineer, @Walmartlabs, USA
Your graphics add a nice touch to my presentations and I recently used them for one of my all-hands meetings. Your toolbox adds professionalism to my slides. Instead of using standard clipart.
Claude Jones, Director of Engineer, @Walmartlabs, USA
I needed a fresh look at some of my slides. I've tried to find a way to create a paintbrush effect, to underline, accentuate, add some color and the handwritten markers were just the things. Very easy to use, easy to size, change the color. It was an affordable, perfect solution and I'm happy to recommend it.
Anonymous, US
The crisp, clean look of the graphics, and the fact that it allowed me to easily edit and change the colors to match the template was my main reason for purchasing them.
Brandie Jenkins, E-learning Developer, USA
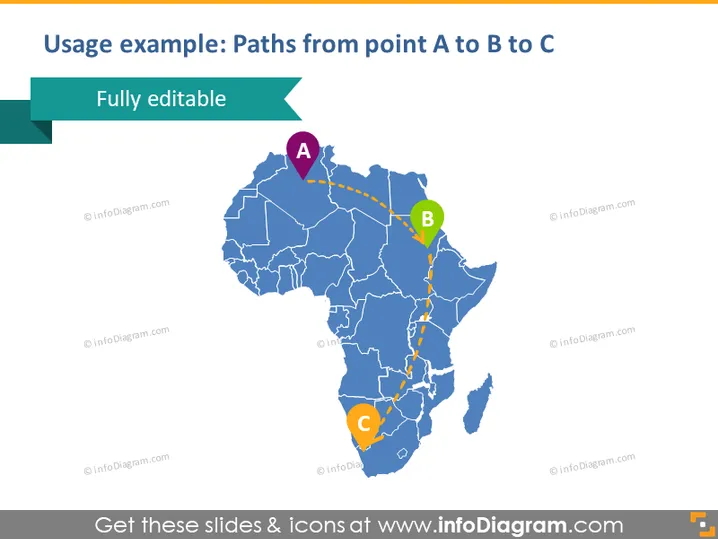
The slide presents a graphic illustration showing possible paths or connections between three points marked as A, B, and C on the map of Africa. Each point is represented by a colored circle with a letter inside, and the paths are shown as dotted lines. Points A and B are connected, as well as points B and C, indicating a sequence or process that moves from A through B to C.
The slide has a clean and professional appearance, utilizing a color scheme that contrasts well against the blue map. The simplicity of the design directs focus to the paths and points of interest on the map.


