Your graphics add a nice touch to my presentations and I recently used them for one of my all-hands meetings. Your toolbox adds professionalism to my slides. Instead of using standard clipart.
Claude Jones, Director of Engineer, @Walmartlabs, USA
Your graphics add a nice touch to my presentations and I recently used them for one of my all-hands meetings. Your toolbox adds professionalism to my slides. Instead of using standard clipart.
Claude Jones, Director of Engineer, @Walmartlabs, USA
I needed a fresh look at some of my slides. I've tried to find a way to create a paintbrush effect, to underline, accentuate, add some color and the handwritten markers were just the things. Very easy to use, easy to size, change the color. It was an affordable, perfect solution and I'm happy to recommend it.
Anonymous, US
The crisp, clean look of the graphics, and the fact that it allowed me to easily edit and change the colors to match the template was my main reason for purchasing them.
Brandie Jenkins, E-learning Developer, USA
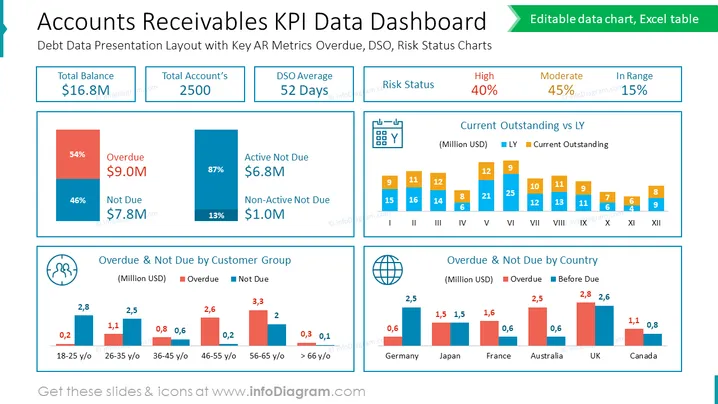
The slide provides a visual representation of key performance indicators for accounts receivables. It includes six distinct sections. "Total Balance" shows $16.8M, indicating the overall amount pending. "Total Account’s Active" specifies 2500 accounts in operation. "DSO Average" reveals the average days sales outstanding as 52 days. "Risk Status" categorizes risk into 'High' at 40%, 'Moderate' at 45%, and 'In Range' at 15%. Two bar charts compare "Current Outstanding vs LY" in millions across months, while the other two display "Overdue & Not Due" by customer age group and by country, highlighting the proportion of amounts overdue versus not yet due.
The overall look of the slide is clean and corporate, employing a strong visual hierarchy that guides the viewer's eye through the various data points efficiently. The use of bold colors and clear text ensures legibility and quick comprehension.


