Your graphics add a nice touch to my presentations and I recently used them for one of my all-hands meetings. Your toolbox adds professionalism to my slides. Instead of using standard clipart.
Claude Jones, Director of Engineer, @Walmartlabs, USA
Your graphics add a nice touch to my presentations and I recently used them for one of my all-hands meetings. Your toolbox adds professionalism to my slides. Instead of using standard clipart.
Claude Jones, Director of Engineer, @Walmartlabs, USA
I needed a fresh look at some of my slides. I've tried to find a way to create a paintbrush effect, to underline, accentuate, add some color and the handwritten markers were just the things. Very easy to use, easy to size, change the color. It was an affordable, perfect solution and I'm happy to recommend it.
Anonymous, US
The crisp, clean look of the graphics, and the fact that it allowed me to easily edit and change the colors to match the template was my main reason for purchasing them.
Brandie Jenkins, E-learning Developer, USA
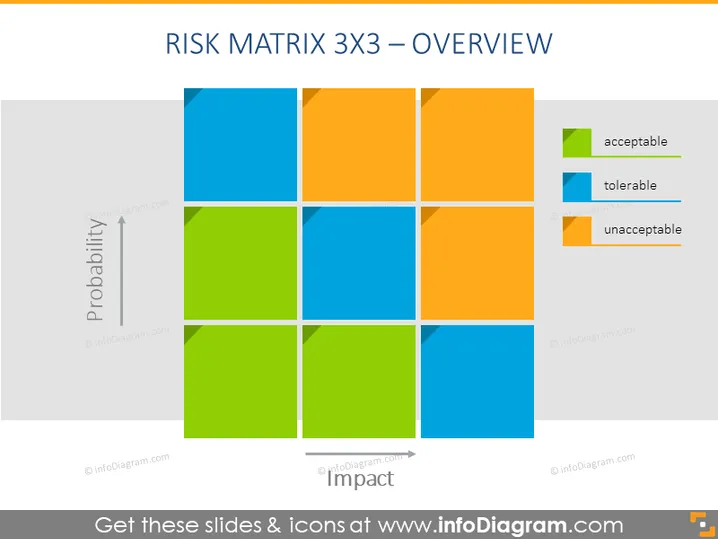
The slide presents a Risk Matrix 3x3 Overview, which is a tool used for assessing risks by plotting the probability of occurrences against the impact if they do occur. Each square on the 3x3 matrix represents a distinct risk level, with color-coding indicating the severity: green for "acceptable," blue for "tolerable," and orange for "unacceptable." The vertical axis indicates the probability of a risk occurring, and the horizontal axis represents the impact level of the risk.
The slide's design is straightforward and professional, with a strong emphasis on functionality and clarity. The color coding provides an at-a-glance understanding of the risk levels.


