

Your graphics add a nice touch to my presentations and I recently used them for one of my all-hands meetings. Your toolbox adds professionalism to my slides. Instead of using standard clipart.
Claude Jones, Director of Engineer, @Walmartlabs, USA

Your graphics add a nice touch to my presentations and I recently used them for one of my all-hands meetings. Your toolbox adds professionalism to my slides. Instead of using standard clipart.
Claude Jones, Director of Engineer, @Walmartlabs, USA
I needed a fresh look at some of my slides. I've tried to find a way to create a paintbrush effect, to underline, accentuate, add some color and the handwritten markers were just the things. Very easy to use, easy to size, change the color. It was an affordable, perfect solution and I'm happy to recommend it.
Anonymous, US
The crisp, clean look of the graphics, and the fact that it allowed me to easily edit and change the colors to match the template was my main reason for purchasing them.
Brandie Jenkins, E-learning Developer, USA
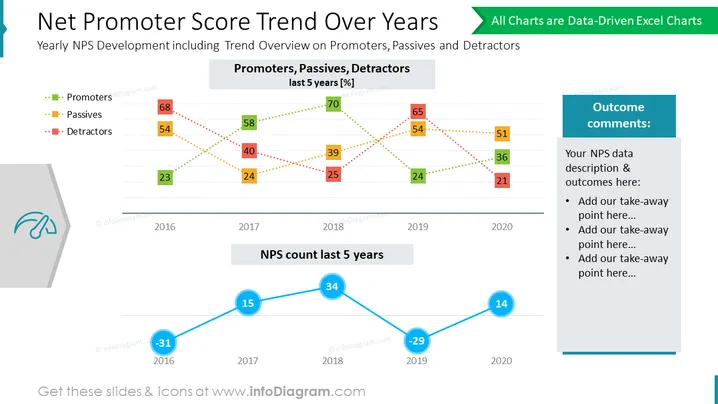
Cette diapositive PowerPoint fournit une représentation visuelle des tendances du Net Promoter Score (NPS) sur une période de cinq ans. Elle illustre efficacement le pourcentage de promoteurs, passifs et détracteurs, ainsi que le total du NPS pour chaque année. Cette diapositive peut être utilisée dans des présentations commerciales pour suivre la fidélité et les niveaux de satisfaction des clients, identifier des domaines à améliorer et mesurer l'impact des initiatives en matière d'expérience client.
est une partie de nos Tableaux de Bord d'Analyse NPS pour les Indicateurs de Fidélité Client PPT Template.



