
Your graphics add a nice touch to my presentations and I recently used them for one of my all-hands meetings. Your toolbox adds professionalism to my slides. Instead of using standard clipart.
Claude Jones, Director of Engineer, @Walmartlabs, USA
Your graphics add a nice touch to my presentations and I recently used them for one of my all-hands meetings. Your toolbox adds professionalism to my slides. Instead of using standard clipart.
Claude Jones, Director of Engineer, @Walmartlabs, USA
I needed a fresh look at some of my slides. I've tried to find a way to create a paintbrush effect, to underline, accentuate, add some color and the handwritten markers were just the things. Very easy to use, easy to size, change the color. It was an affordable, perfect solution and I'm happy to recommend it.
Anonymous, US
The crisp, clean look of the graphics, and the fact that it allowed me to easily edit and change the colors to match the template was my main reason for purchasing them.
Brandie Jenkins, E-learning Developer, USA
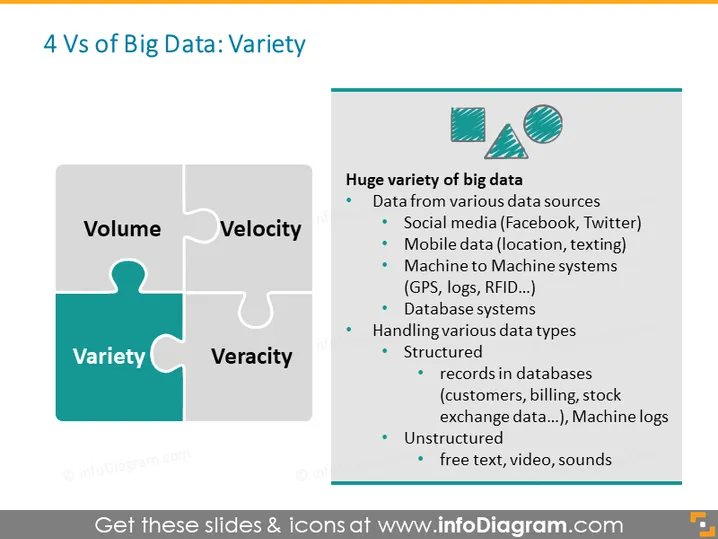
La diapositiva se centra en "Variedad", una de las cuatro dimensiones de Big Data, a menudo llamada las 4 V. Explica que la variedad en Big Data proviene de numerosas fuentes de datos como redes sociales, datos móviles, sistemas de máquina a máquina y sistemas de bases de datos. Indica que hay diferentes tipos de datos: estructurados, que incluyen registros en bases de datos como información de clientes y de facturación, datos de mercados financieros y registros de máquinas; y no estructurados, como texto libre, videos y sonidos, destacando las diversas formas que puede adoptar Big Data.
La diapositiva tiene un diseño limpio y profesional con una paleta de colores gris y azul verdoso. El uso de piezas de rompecabezas representa eficazmente el concepto de componentes interconectados de Big Data.




