
Your graphics add a nice touch to my presentations and I recently used them for one of my all-hands meetings. Your toolbox adds professionalism to my slides. Instead of using standard clipart.
Claude Jones, Director of Engineer, @Walmartlabs, USA
Your graphics add a nice touch to my presentations and I recently used them for one of my all-hands meetings. Your toolbox adds professionalism to my slides. Instead of using standard clipart.
Claude Jones, Director of Engineer, @Walmartlabs, USA
I needed a fresh look at some of my slides. I've tried to find a way to create a paintbrush effect, to underline, accentuate, add some color and the handwritten markers were just the things. Very easy to use, easy to size, change the color. It was an affordable, perfect solution and I'm happy to recommend it.
Anonymous, US
The crisp, clean look of the graphics, and the fact that it allowed me to easily edit and change the colors to match the template was my main reason for purchasing them.
Brandie Jenkins, E-learning Developer, USA
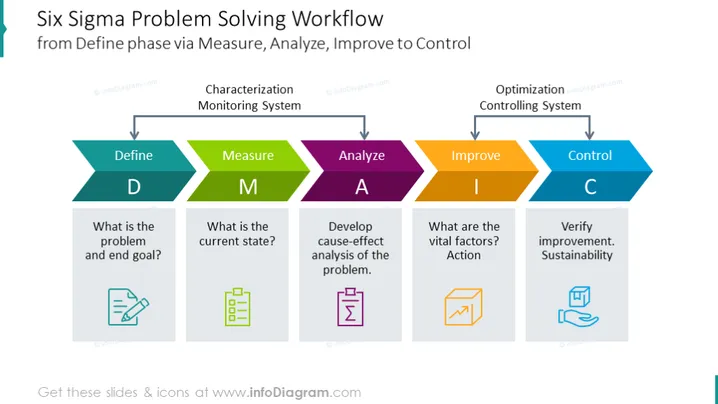
Diagrama de flujo de resolución de problemas de Six Sigma en PowerPoint que ilustra el proceso desde la definición hasta la medición, análisis, mejora y control. Explica el método DMAIC dando ejemplos de cada paso del proceso y describiendo las fases de monitoreo y control del sistema. Infórmese sobre DMAIC y Six Sigma en Wikipedia.
Este flujo de trabajo para la resolución de problemas mostrado con una plantilla de iconos de esquema y contorno es parte de nuestra plantilla de presentación de diagramas DMAIC de Six Sigma.




