Your graphics add a nice touch to my presentations and I recently used them for one of my all-hands meetings. Your toolbox adds professionalism to my slides. Instead of using standard clipart.
Claude Jones, Director of Engineer, @Walmartlabs, USA
Your graphics add a nice touch to my presentations and I recently used them for one of my all-hands meetings. Your toolbox adds professionalism to my slides. Instead of using standard clipart.
Claude Jones, Director of Engineer, @Walmartlabs, USA
I needed a fresh look at some of my slides. I've tried to find a way to create a paintbrush effect, to underline, accentuate, add some color and the handwritten markers were just the things. Very easy to use, easy to size, change the color. It was an affordable, perfect solution and I'm happy to recommend it.
Anonymous, US
The crisp, clean look of the graphics, and the fact that it allowed me to easily edit and change the colors to match the template was my main reason for purchasing them.
Brandie Jenkins, E-learning Developer, USA
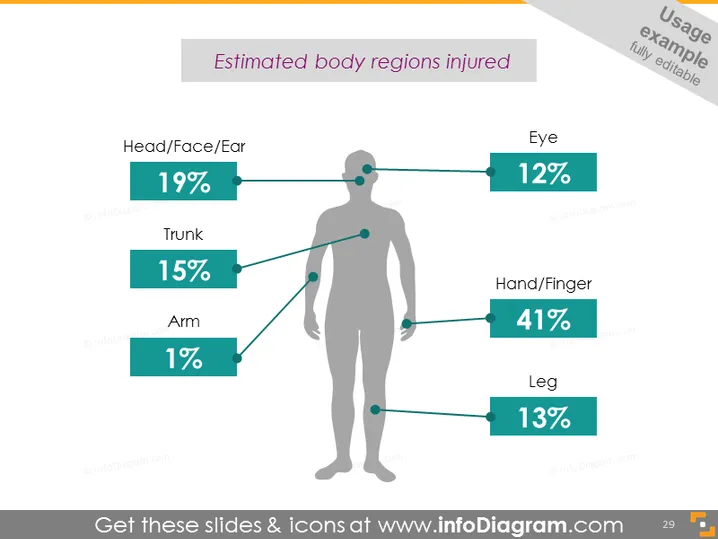
La diapositiva presenta datos estadísticos sobre el porcentaje estimado de regiones corporales lesionadas, posiblemente en un entorno laboral u otro escenario donde se recopilan datos de lesiones. Se especifican cinco regiones corporales con sus respectivos porcentajes de lesiones: Cabeza/Cara/Oído (19%), Tronco (15%), Brazo (1%), Ojo (12%), Mano/Dedo (41%) y Pierna (13%). Cada porcentaje indica presumiblemente la frecuencia o probabilidad de lesiones en esa región corporal en un conjunto de datos específico.
La apariencia general de la diapositiva es limpia y moderna, con un diseño minimalista que se centra en la representación de datos. La elección de color verde azulado para los rectángulos de datos y verde para las líneas crea un tema visual cohesivo.


