Your graphics add a nice touch to my presentations and I recently used them for one of my all-hands meetings. Your toolbox adds professionalism to my slides. Instead of using standard clipart.
Claude Jones, Director of Engineer, @Walmartlabs, USA
Your graphics add a nice touch to my presentations and I recently used them for one of my all-hands meetings. Your toolbox adds professionalism to my slides. Instead of using standard clipart.
Claude Jones, Director of Engineer, @Walmartlabs, USA
I needed a fresh look at some of my slides. I've tried to find a way to create a paintbrush effect, to underline, accentuate, add some color and the handwritten markers were just the things. Very easy to use, easy to size, change the color. It was an affordable, perfect solution and I'm happy to recommend it.
Anonymous, US
The crisp, clean look of the graphics, and the fact that it allowed me to easily edit and change the colors to match the template was my main reason for purchasing them.
Brandie Jenkins, E-learning Developer, USA
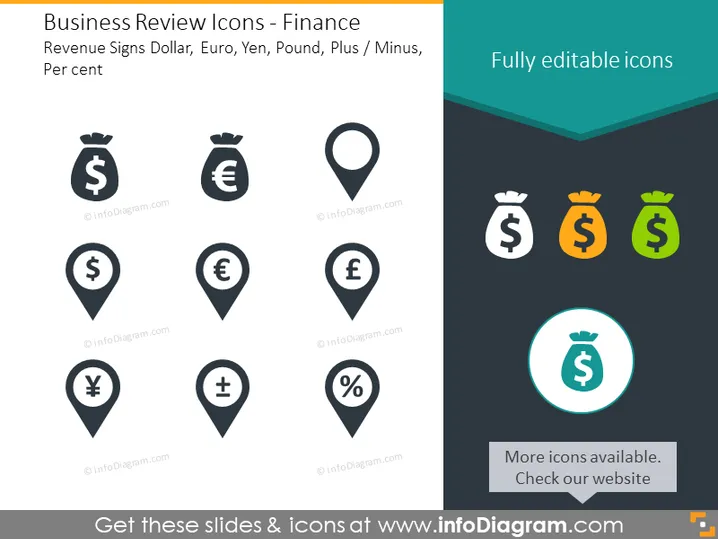
Esta diapositiva de PowerPoint presenta una colección de íconos relacionados con las finanzas que representan varias monedas y conceptos financieros. Los íconos incluyen bolsas con símbolos de moneda para el dólar, euro, yen y libra, sugiriendo ingresos o finanzas en diferentes regiones geográficas. Los signos de más y menos representan cambios o ajustes financieros positivos y negativos, mientras que el símbolo de porcentaje se asocia comúnmente con tasas de interés, descuentos o tasas de crecimiento. Estos simples elementos visuales ayudan a transmitir rápidamente conceptos o estados financieros.
La diapositiva hace uso de formas geométricas como círculos y la forma de pin de marcador en un mapa para enmarcar los íconos financieros, creando un aspecto visualmente organizado. El uso de color resalta elementos específicos en la diapositiva, haciéndolos destacar.


