

Your graphics add a nice touch to my presentations and I recently used them for one of my all-hands meetings. Your toolbox adds professionalism to my slides. Instead of using standard clipart.
Claude Jones, Director of Engineer, @Walmartlabs, USA

Your graphics add a nice touch to my presentations and I recently used them for one of my all-hands meetings. Your toolbox adds professionalism to my slides. Instead of using standard clipart.
Claude Jones, Director of Engineer, @Walmartlabs, USA
I needed a fresh look at some of my slides. I've tried to find a way to create a paintbrush effect, to underline, accentuate, add some color and the handwritten markers were just the things. Very easy to use, easy to size, change the color. It was an affordable, perfect solution and I'm happy to recommend it.
Anonymous, US
The crisp, clean look of the graphics, and the fact that it allowed me to easily edit and change the colors to match the template was my main reason for purchasing them.
Brandie Jenkins, E-learning Developer, USA
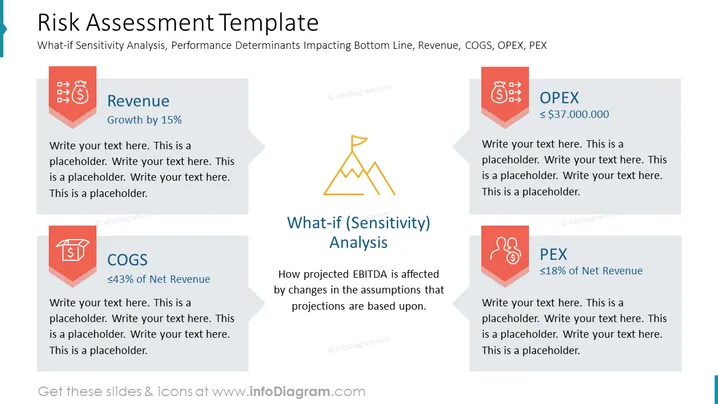
La diapositiva se titula "Plantilla de Evaluación de Riesgos" y trata sobre el Análisis de Sensibilidad de Qué Pasaría Si, identificando los determinantes del rendimiento que impactan el resultado final, incluyendo Ingresos, COGS (Costos de Bienes Vendidos), OPEX (Gastos Operativos) y PEX (Gastos Planificados). Presenta cuatro áreas clave: Ingresos con un objetivo de crecimiento del 15%, COGS que debe ser menos del 43% de los ingresos netos, OPEX con un monto menor o igual a $37,000,000, y PEX que debe ser menos del 18% de los ingresos netos. La gráfica central trata sobre el Análisis de Qué Pasaría Si (Sensibilidad), explicando cómo el EBITDA proyectado se ve afectado por cambios en las suposiciones.



