

Your graphics add a nice touch to my presentations and I recently used them for one of my all-hands meetings. Your toolbox adds professionalism to my slides. Instead of using standard clipart.
Claude Jones, Director of Engineer, @Walmartlabs, USA

Your graphics add a nice touch to my presentations and I recently used them for one of my all-hands meetings. Your toolbox adds professionalism to my slides. Instead of using standard clipart.
Claude Jones, Director of Engineer, @Walmartlabs, USA
I needed a fresh look at some of my slides. I've tried to find a way to create a paintbrush effect, to underline, accentuate, add some color and the handwritten markers were just the things. Very easy to use, easy to size, change the color. It was an affordable, perfect solution and I'm happy to recommend it.
Anonymous, US
The crisp, clean look of the graphics, and the fact that it allowed me to easily edit and change the colors to match the template was my main reason for purchasing them.
Brandie Jenkins, E-learning Developer, USA
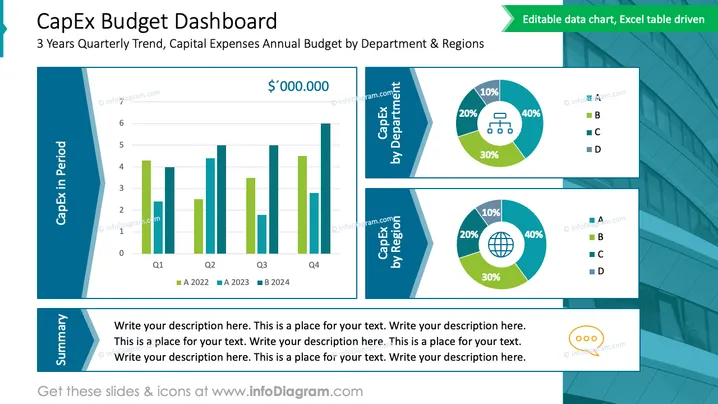
Esta diapositiva de PowerPoint se titula "Panel de Presupuesto de CapEx" y muestra una Tendencia Trimestral de 3 Años y un Presupuesto Anual de Gastos de Capital por Departamento y Regiones. La diapositiva está estructurada en tres secciones: un gráfico de barras que ilustra los gastos de capital (CapEx) durante cuatro trimestres de dos años diferentes, y dos gráficos de donas que desglosan los gastos por departamento y por región. Cada sección está claramente etiquetada, y los gráficos de donas presentan desgloses porcentuales para cuatro categorías, denominadas A, B, C y D, lo que permite al espectador evaluar rápidamente la distribución de CapEx.
La diapositiva tiene un diseño limpio y profesional con un buen equilibrio de texto, gráficos y elementos de diseño estético. Los tonos contrastantes de azul y verde añaden interés visual y ayudan a distinguir varios puntos de datos.



