Your graphics add a nice touch to my presentations and I recently used them for one of my all-hands meetings. Your toolbox adds professionalism to my slides. Instead of using standard clipart.
Claude Jones, Director of Engineer, @Walmartlabs, USA
Your graphics add a nice touch to my presentations and I recently used them for one of my all-hands meetings. Your toolbox adds professionalism to my slides. Instead of using standard clipart.
Claude Jones, Director of Engineer, @Walmartlabs, USA
I needed a fresh look at some of my slides. I've tried to find a way to create a paintbrush effect, to underline, accentuate, add some color and the handwritten markers were just the things. Very easy to use, easy to size, change the color. It was an affordable, perfect solution and I'm happy to recommend it.
Anonymous, US
The crisp, clean look of the graphics, and the fact that it allowed me to easily edit and change the colors to match the template was my main reason for purchasing them.
Brandie Jenkins, E-learning Developer, USA
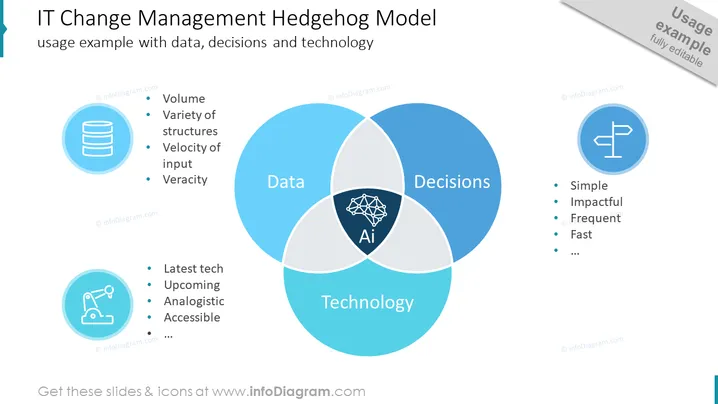
con ejemplo de uso - datos, decisiones y tecnología. Datos - Volumen, Variedad de Estructuras, Velocidad de Entrada, Veracidad. Decisiones - Simples, Impactantes, Frecuentes y Rápidas. Tecnología - Última Tecnología, Próxima, Análoga y Accesible. Todos son parte de la IA. ## Descripción de la infografía de la diapositiva: Fondo Blanco, Diagrama de Venn Infográfico, Puntos Clave, Íconos Planos, Ícono de Contorno Redondo Plano, Ícono de Big Data, Ícono de Decisión, Ícono de Bandera, Ícono de Construcción de Grúa, Ícono de Tecnología, Ícono de Inteligencia Artificial IA, Gráficos Totalmente Editables


