

Your graphics add a nice touch to my presentations and I recently used them for one of my all-hands meetings. Your toolbox adds professionalism to my slides. Instead of using standard clipart.
Claude Jones, Director of Engineer, @Walmartlabs, USA

Your graphics add a nice touch to my presentations and I recently used them for one of my all-hands meetings. Your toolbox adds professionalism to my slides. Instead of using standard clipart.
Claude Jones, Director of Engineer, @Walmartlabs, USA
I needed a fresh look at some of my slides. I've tried to find a way to create a paintbrush effect, to underline, accentuate, add some color and the handwritten markers were just the things. Very easy to use, easy to size, change the color. It was an affordable, perfect solution and I'm happy to recommend it.
Anonymous, US
The crisp, clean look of the graphics, and the fact that it allowed me to easily edit and change the colors to match the template was my main reason for purchasing them.
Brandie Jenkins, E-learning Developer, USA
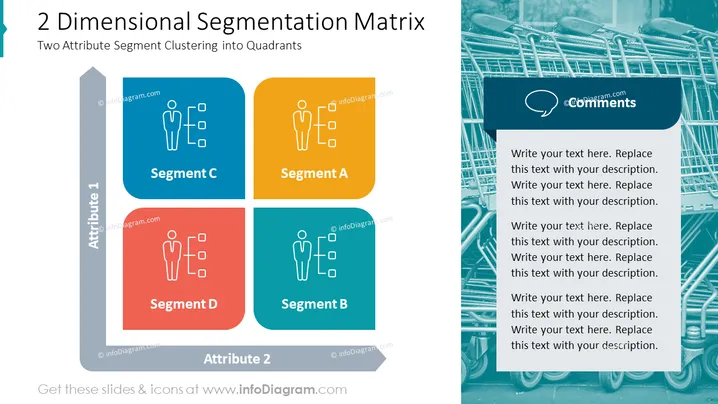
La diapositiva titulada "Matriz de Segmentación 2 Dimensional" trata sobre el concepto de agrupar atributos en cuadrantes. El Segmento A representa un agrupamiento con altos valores para tanto el Atributo 1 como el Atributo 2, sugiriendo un segmento deseable o premium. El Segmento B podría representar un valor más bajo para el Atributo 1 pero aún alto en el Atributo 2, lo que podría indicar un segmento potencialmente en crecimiento o específico. El Segmento C puede mostrar altos valores en el Atributo 1 pero bajos en el Atributo 2, quizás un segmento que es fuerte en un aspecto pero más débil en otro. Por último, el Segmento D representa bajos valores en ambos atributos, generalmente considerado el segmento menos deseable.



