
Your graphics add a nice touch to my presentations and I recently used them for one of my all-hands meetings. Your toolbox adds professionalism to my slides. Instead of using standard clipart.
Claude Jones, Director of Engineer, @Walmartlabs, USA
Your graphics add a nice touch to my presentations and I recently used them for one of my all-hands meetings. Your toolbox adds professionalism to my slides. Instead of using standard clipart.
Claude Jones, Director of Engineer, @Walmartlabs, USA
I needed a fresh look at some of my slides. I've tried to find a way to create a paintbrush effect, to underline, accentuate, add some color and the handwritten markers were just the things. Very easy to use, easy to size, change the color. It was an affordable, perfect solution and I'm happy to recommend it.
Anonymous, US
The crisp, clean look of the graphics, and the fact that it allowed me to easily edit and change the colors to match the template was my main reason for purchasing them.
Brandie Jenkins, E-learning Developer, USA
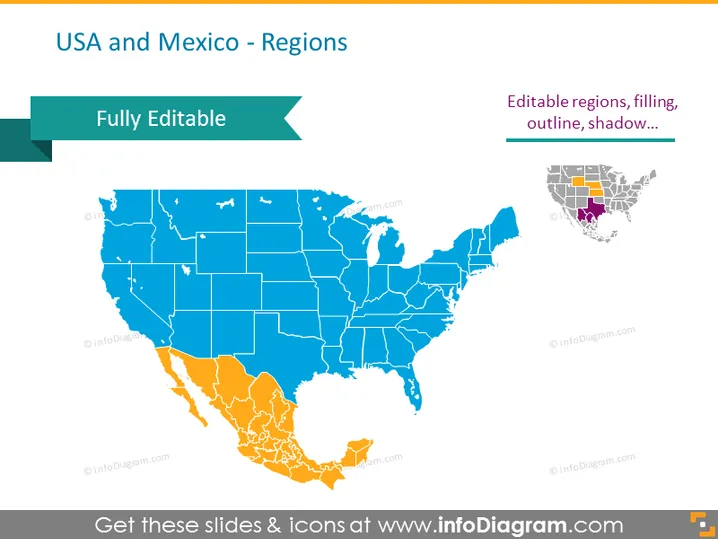
La diapositiva titulada "EE.UU. y México - Regiones" presenta un mapa prominente que diferencia a los Estados Unidos y México mediante un código de colores: EE.UU. en azul y México en naranja. Un mapa inserto más pequeño de EE.UU. indica las regiones que son editables con atributos como relleno, contorno y sombra. Cada concepto implica que la diapositiva es personalizable, donde los colores, bordes y sombras de las regiones se pueden ajustar según sea necesario.
La diapositiva muestra un diseño limpio y profesional con una clara diferenciación entre dos países utilizando color. La editabilidad se enfatiza tanto a través del texto como del diseño visual, sugiriendo una herramienta funcional para presentaciones.




