Your graphics add a nice touch to my presentations and I recently used them for one of my all-hands meetings. Your toolbox adds professionalism to my slides. Instead of using standard clipart.
Claude Jones, Director of Engineer, @Walmartlabs, USA
Your graphics add a nice touch to my presentations and I recently used them for one of my all-hands meetings. Your toolbox adds professionalism to my slides. Instead of using standard clipart.
Claude Jones, Director of Engineer, @Walmartlabs, USA
I needed a fresh look at some of my slides. I've tried to find a way to create a paintbrush effect, to underline, accentuate, add some color and the handwritten markers were just the things. Very easy to use, easy to size, change the color. It was an affordable, perfect solution and I'm happy to recommend it.
Anonymous, US
The crisp, clean look of the graphics, and the fact that it allowed me to easily edit and change the colors to match the template was my main reason for purchasing them.
Brandie Jenkins, E-learning Developer, USA
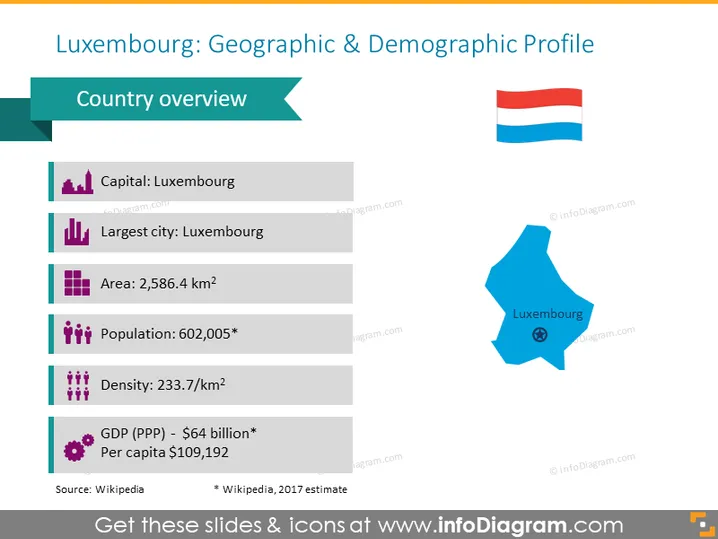
La población de Luxemburgo a 1 de enero de 2022 era de 645,397 (52.87% luxemburgueses y 47.13% de nacionalidades extranjeras). Wikipedia
Esta plantilla de presentación es una visión general ordenada del perfil demográfico y geográfico del país. Incluye un mapa junto con una tabla de resumen fácil de leer para 6 características diferentes.
Esta diapositiva del mapa del perfil demográfico y geográfico de Luxemburgo es parte de nuestras Plantillas de Presentación de Mapas de Europa Benelux con Territorios Administrativos.


