

Your graphics add a nice touch to my presentations and I recently used them for one of my all-hands meetings. Your toolbox adds professionalism to my slides. Instead of using standard clipart.
Claude Jones, Director of Engineer, @Walmartlabs, USA

Your graphics add a nice touch to my presentations and I recently used them for one of my all-hands meetings. Your toolbox adds professionalism to my slides. Instead of using standard clipart.
Claude Jones, Director of Engineer, @Walmartlabs, USA
I needed a fresh look at some of my slides. I've tried to find a way to create a paintbrush effect, to underline, accentuate, add some color and the handwritten markers were just the things. Very easy to use, easy to size, change the color. It was an affordable, perfect solution and I'm happy to recommend it.
Anonymous, US
The crisp, clean look of the graphics, and the fact that it allowed me to easily edit and change the colors to match the template was my main reason for purchasing them.
Brandie Jenkins, E-learning Developer, USA
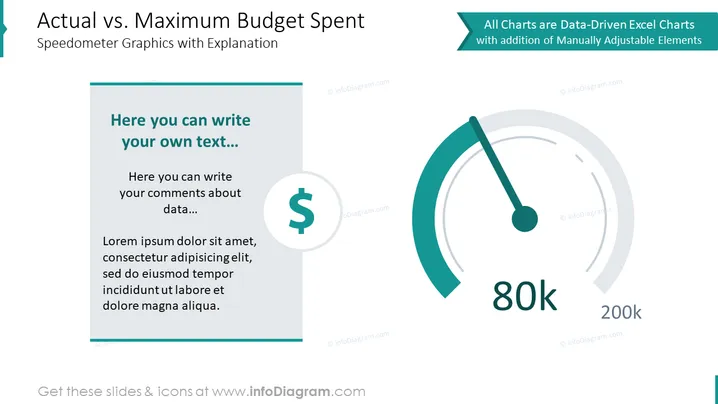
La diapositiva presenta una comparación del presupuesto real frente al máximo gastado utilizando gráficos de velocímetro para la visualización. El lado izquierdo de la diapositiva tiene un cuadro de texto donde se puede agregar un comentario personalizado sobre los datos presentados, comenzando con una indicación "Aquí puedes escribir tu propio texto...". Le sigue un texto de muestra, ilustrando dónde se podría incluir más detalle o análisis para detallar el gasto del presupuesto.
La diapositiva es limpia y de aspecto profesional con una paleta de colores que utiliza teal, azul y gris, que son agradables a la vista y dan una impresión de presentación de datos organizada.



