
Your graphics add a nice touch to my presentations and I recently used them for one of my all-hands meetings. Your toolbox adds professionalism to my slides. Instead of using standard clipart.
Claude Jones, Director of Engineer, @Walmartlabs, USA
Your graphics add a nice touch to my presentations and I recently used them for one of my all-hands meetings. Your toolbox adds professionalism to my slides. Instead of using standard clipart.
Claude Jones, Director of Engineer, @Walmartlabs, USA
I needed a fresh look at some of my slides. I've tried to find a way to create a paintbrush effect, to underline, accentuate, add some color and the handwritten markers were just the things. Very easy to use, easy to size, change the color. It was an affordable, perfect solution and I'm happy to recommend it.
Anonymous, US
The crisp, clean look of the graphics, and the fact that it allowed me to easily edit and change the colors to match the template was my main reason for purchasing them.
Brandie Jenkins, E-learning Developer, USA
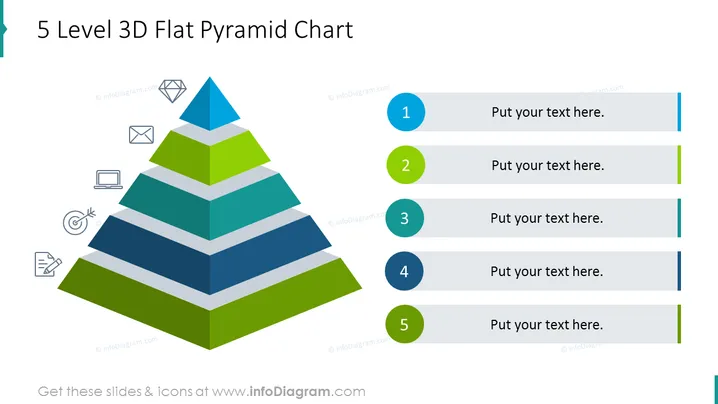
La diapositiva muestra un gráfico de pirámide de 5 niveles para categorizar y visualizar estructuras jerárquicas. Cada nivel de la pirámide está asociado con un número y tiene espacio para texto, representando un paso o rango en una secuencia progresiva. Este tipo de gráfico se utiliza a menudo para representar estructuras organizativas, etapas de crecimiento o priorización de conceptos, con el nivel más importante en la parte superior, volviéndose menos crítico a medida que la pirámide se ensancha.
La diapositiva tiene un diseño vibrante y claro, con un gráfico de pirámide colorido que la hace visualmente atractiva. Cada elemento se presenta de manera limpia con bordes y colores distintos, facilitando la legibilidad y la interpretación.




