

Your graphics add a nice touch to my presentations and I recently used them for one of my all-hands meetings. Your toolbox adds professionalism to my slides. Instead of using standard clipart.
Claude Jones, Director of Engineer, @Walmartlabs, USA

Your graphics add a nice touch to my presentations and I recently used them for one of my all-hands meetings. Your toolbox adds professionalism to my slides. Instead of using standard clipart.
Claude Jones, Director of Engineer, @Walmartlabs, USA
I needed a fresh look at some of my slides. I've tried to find a way to create a paintbrush effect, to underline, accentuate, add some color and the handwritten markers were just the things. Very easy to use, easy to size, change the color. It was an affordable, perfect solution and I'm happy to recommend it.
Anonymous, US
The crisp, clean look of the graphics, and the fact that it allowed me to easily edit and change the colors to match the template was my main reason for purchasing them.
Brandie Jenkins, E-learning Developer, USA
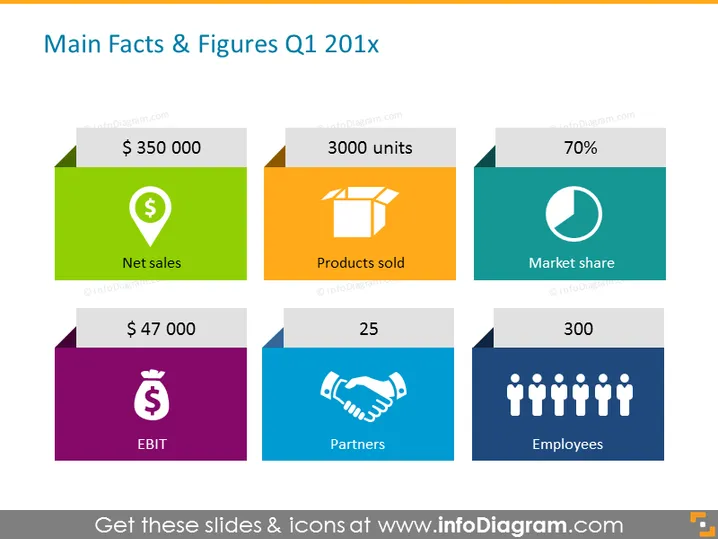
destaca los logros más importantes durante un trimestre. Anota tus ventas netas, productos vendidos, cuota de mercado, EBIT, asociaciones, y el número de empleados. Reemplaza las tablas estándar que lucen muy aburridas y poco atractivas, con infografías interesantes e íconos representativos tu presentación más limpia y ayudar a tu audiencia a entender el tema y el flujo de la presentación sin problemas. Puedes simplemente actualizar las cifras con las reales o hacer cambios menores editando las formas. La presentación se puede descargar en otros software, como Google Slides y Keynote, manteniendo la calidad de los elementos. Haz clic en la imagen para ver más ilustraciones de diapositivas de actualización de negocios minoristas. ## Plantilla de PowerPoint de Datos y Cifras Infografías Cajas Coloridas, Ícono de Ventas Netas, Ícono de Caja 3D, Gráfico Circular, Ícono de Bolsa de Dinero, Ícono de Apretón de Manos, Ícono de Personal



