
Your graphics add a nice touch to my presentations and I recently used them for one of my all-hands meetings. Your toolbox adds professionalism to my slides. Instead of using standard clipart.
Claude Jones, Director of Engineer, @Walmartlabs, USA
Your graphics add a nice touch to my presentations and I recently used them for one of my all-hands meetings. Your toolbox adds professionalism to my slides. Instead of using standard clipart.
Claude Jones, Director of Engineer, @Walmartlabs, USA
I needed a fresh look at some of my slides. I've tried to find a way to create a paintbrush effect, to underline, accentuate, add some color and the handwritten markers were just the things. Very easy to use, easy to size, change the color. It was an affordable, perfect solution and I'm happy to recommend it.
Anonymous, US
The crisp, clean look of the graphics, and the fact that it allowed me to easily edit and change the colors to match the template was my main reason for purchasing them.
Brandie Jenkins, E-learning Developer, USA
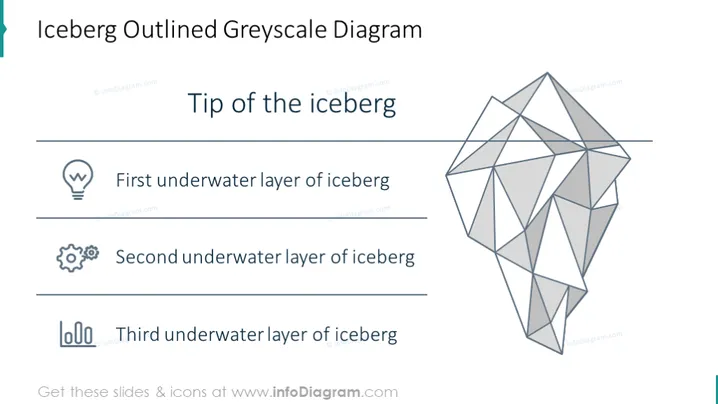
La diapositiva presenta un "Diagrama de Escala de Grises del Iceberg", representando un modelo que divide conceptos en capas observables y ocultas. La "Punta del iceberg" se refiere a lo que es visible y fácilmente perceptible. Bajo la superficie, la "Primera capa submarina del iceberg" representa información oculta inicial que puede descubrirse con alguna investigación. La "Segunda capa submarina del iceberg" aborda problemas más profundos y complejos, y la "Tercera capa submarina del iceberg" alcanza los factores subyacentes que son típicamente los más difíciles de identificar y comprender.
La diapositiva tiene un aspecto elegante y profesional, utilizando una paleta de colores monocromática que enfatiza la claridad y simplicidad en la transmisión de la estructura en capas del modelo del iceberg.




