

Your graphics add a nice touch to my presentations and I recently used them for one of my all-hands meetings. Your toolbox adds professionalism to my slides. Instead of using standard clipart.
Claude Jones, Director of Engineer, @Walmartlabs, USA

Your graphics add a nice touch to my presentations and I recently used them for one of my all-hands meetings. Your toolbox adds professionalism to my slides. Instead of using standard clipart.
Claude Jones, Director of Engineer, @Walmartlabs, USA
I needed a fresh look at some of my slides. I've tried to find a way to create a paintbrush effect, to underline, accentuate, add some color and the handwritten markers were just the things. Very easy to use, easy to size, change the color. It was an affordable, perfect solution and I'm happy to recommend it.
Anonymous, US
The crisp, clean look of the graphics, and the fact that it allowed me to easily edit and change the colors to match the template was my main reason for purchasing them.
Brandie Jenkins, E-learning Developer, USA
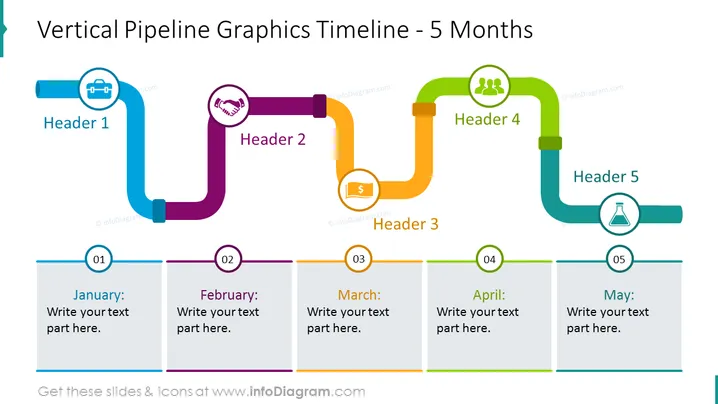
La diapositiva de PowerPoint "Línea de tiempo de gráficos de pipeline vertical - 5 meses" describe un proceso de 5 pasos, simbolizando una línea de tiempo que abarca de enero a mayo. Cada paso está etiquetado con un encabezado y un ícono que corresponde a una etapa o tema diferente, como finanzas o trabajo en equipo. Las etapas están conectadas con segmentos de pipeline vertical y horizontal, sugiriendo una progresión o flujo de trabajo. La línea de tiempo parece ser una herramienta para mapear tareas clave, hitos o eventos en un formato mensual.
El aspecto general de la diapositiva es vibrante y bien organizado, utilizando una mezcla de gráficos codificados por colores para transmitir un proceso secuencial. Este enfoque visual facilita el seguimiento del flujo de actividades o hitos durante el período de 5 meses.



