Your graphics add a nice touch to my presentations and I recently used them for one of my all-hands meetings. Your toolbox adds professionalism to my slides. Instead of using standard clipart.
Claude Jones, Director of Engineer, @Walmartlabs, USA
Your graphics add a nice touch to my presentations and I recently used them for one of my all-hands meetings. Your toolbox adds professionalism to my slides. Instead of using standard clipart.
Claude Jones, Director of Engineer, @Walmartlabs, USA
I needed a fresh look at some of my slides. I've tried to find a way to create a paintbrush effect, to underline, accentuate, add some color and the handwritten markers were just the things. Very easy to use, easy to size, change the color. It was an affordable, perfect solution and I'm happy to recommend it.
Anonymous, US
The crisp, clean look of the graphics, and the fact that it allowed me to easily edit and change the colors to match the template was my main reason for purchasing them.
Brandie Jenkins, E-learning Developer, USA
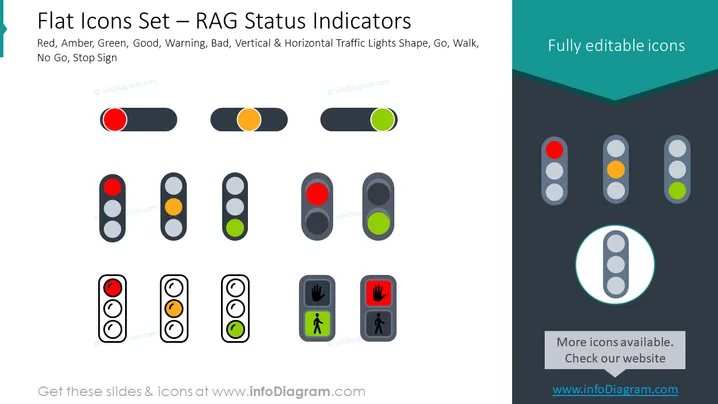
La diapositiva se titula "Conjunto de Iconos Planos – Indicadores de Estado RAG" y muestra una colección de iconos que representan el sistema de estado Rojo, Ámbar y Verde (RAG), que a menudo se utiliza para indicar el estado de un proyecto o niveles de rendimiento. Los símbolos imitan los semáforos e incluyen círculos de un solo color en rojo, ámbar y verde, que normalmente significan alto, precaución y avanzar, respectivamente. Hay versiones verticales y horizontales, así como iconos con figuras de peatones y símbolos de mano, indicando el estado en contexto, como el progreso del proyecto o la preparación operativa.


