

Your graphics add a nice touch to my presentations and I recently used them for one of my all-hands meetings. Your toolbox adds professionalism to my slides. Instead of using standard clipart.
Claude Jones, Director of Engineer, @Walmartlabs, USA

Your graphics add a nice touch to my presentations and I recently used them for one of my all-hands meetings. Your toolbox adds professionalism to my slides. Instead of using standard clipart.
Claude Jones, Director of Engineer, @Walmartlabs, USA
I needed a fresh look at some of my slides. I've tried to find a way to create a paintbrush effect, to underline, accentuate, add some color and the handwritten markers were just the things. Very easy to use, easy to size, change the color. It was an affordable, perfect solution and I'm happy to recommend it.
Anonymous, US
The crisp, clean look of the graphics, and the fact that it allowed me to easily edit and change the colors to match the template was my main reason for purchasing them.
Brandie Jenkins, E-learning Developer, USA
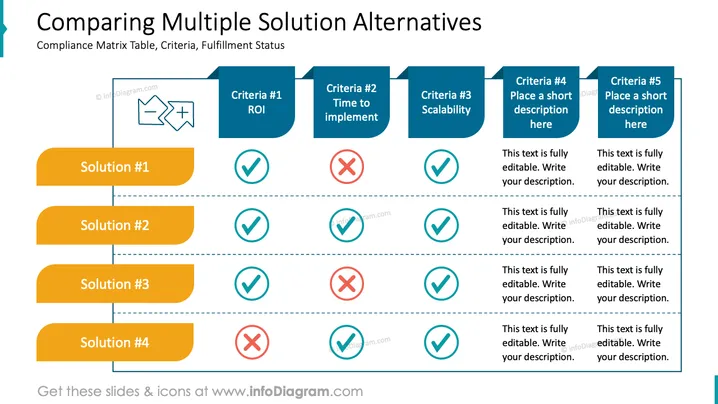
La diapositiva está diseñada para comparar múltiples alternativas de solución utilizando una Tabla de Matriz de Cumplimiento que detalla el estado de cumplimiento según los criterios especificados. La tabla contiene cinco columnas para diferentes criterios, con "ROI" y "Tiempo de implementación" mencionados específicamente. Cada fila representa una solución (#1 a #4), con marcas de verificación y cruces que indican si la solución cumple con los criterios respectivos. Por ejemplo, "ROI" denomina la eficiencia del retorno de la inversión, mientras que "Tiempo de implementación" se refiere a cuán rápido puede estar operativa una solución.



