

Your graphics add a nice touch to my presentations and I recently used them for one of my all-hands meetings. Your toolbox adds professionalism to my slides. Instead of using standard clipart.
Claude Jones, Director of Engineer, @Walmartlabs, USA

Your graphics add a nice touch to my presentations and I recently used them for one of my all-hands meetings. Your toolbox adds professionalism to my slides. Instead of using standard clipart.
Claude Jones, Director of Engineer, @Walmartlabs, USA
I needed a fresh look at some of my slides. I've tried to find a way to create a paintbrush effect, to underline, accentuate, add some color and the handwritten markers were just the things. Very easy to use, easy to size, change the color. It was an affordable, perfect solution and I'm happy to recommend it.
Anonymous, US
The crisp, clean look of the graphics, and the fact that it allowed me to easily edit and change the colors to match the template was my main reason for purchasing them.
Brandie Jenkins, E-learning Developer, USA
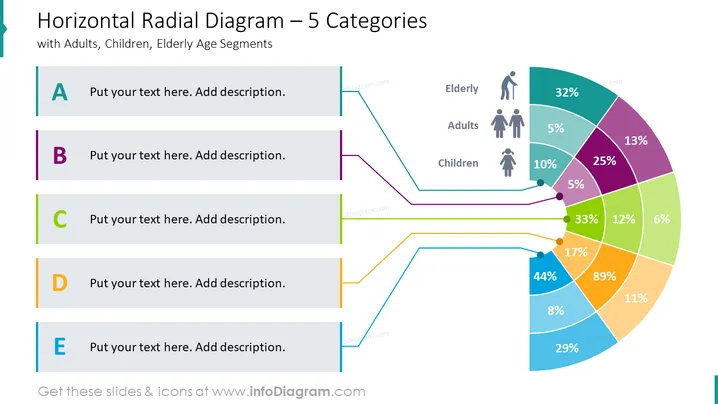
Un diagrama radial horizontal es un tipo de diagrama utilizado para visualizar datos en un semicírculo. Es una forma efectiva de comparar múltiples variables y mostrar la relación entre ellas. Los círculos se dividen en segmentos que representan cada categoría, y sus porcentajes relativos indican cómo están conectadas las variables. Este tipo de diagrama es útil para mostrar información sobre diferentes aspectos de diferentes entidades, en este caso, demografía. También se puede utilizar para comparar varias entidades a la vez, lo que te permite identificar fácilmente patrones y tendencias en los datos. Con sus visuales claros, los diagramas radiales horizontales facilitan la identificación de correlaciones y la creación de diapositivas significativas a partir de tu análisis.
Esta diapositiva de Diagrama Radial Horizontal es parte de nuestra Plantilla de PowerPoint de Diagrama de Ventilador Radial.



