Your graphics add a nice touch to my presentations and I recently used them for one of my all-hands meetings. Your toolbox adds professionalism to my slides. Instead of using standard clipart.
Claude Jones, Director of Engineer, @Walmartlabs, USA
Your graphics add a nice touch to my presentations and I recently used them for one of my all-hands meetings. Your toolbox adds professionalism to my slides. Instead of using standard clipart.
Claude Jones, Director of Engineer, @Walmartlabs, USA
I needed a fresh look at some of my slides. I've tried to find a way to create a paintbrush effect, to underline, accentuate, add some color and the handwritten markers were just the things. Very easy to use, easy to size, change the color. It was an affordable, perfect solution and I'm happy to recommend it.
Anonymous, US
The crisp, clean look of the graphics, and the fact that it allowed me to easily edit and change the colors to match the template was my main reason for purchasing them.
Brandie Jenkins, E-learning Developer, USA
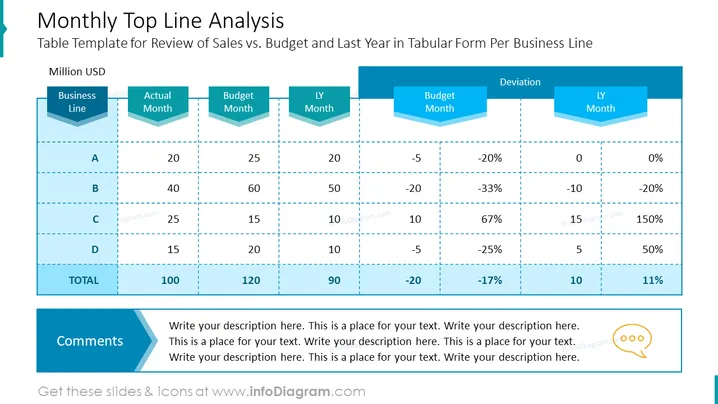
Esta diapositiva titulada 'Análisis Mensual de Ingresos' presenta una plantilla de tabla para revisar las ventas frente al presupuesto y al año pasado en forma tabular por línea de negocio. La tabla enumera cuatro líneas de negocio (A, B, C, D), comparando sus ventas reales y presupuestadas durante un mes, las ventas del mismo mes del año anterior (Mes LY) y calculando las desviaciones entre lo real y el presupuesto, y lo real frente al año pasado. Estas desviaciones se presentan en cifras brutas y en porcentajes, ofreciendo información sobre el rendimiento del negocio y áreas que pueden requerir atención.
La diapositiva utiliza una nítida y profesional paleta de colores dominada por tonos de azul, transmitiendo una sensación de confianza y estabilidad. El uso de efectos 3D y columnas codificadas por colores añade profundidad y enfoque a la presentación de datos.


