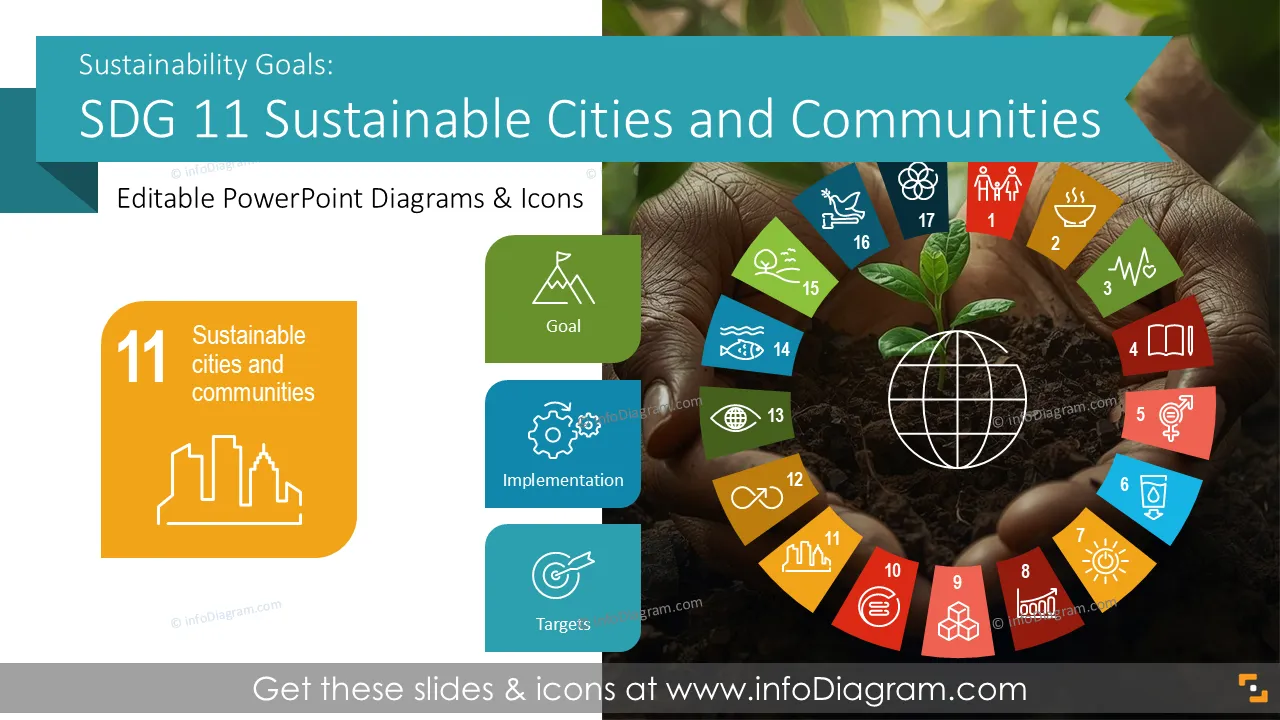
¿Estás presentando actividades relacionadas con el desarrollo urbano o el bienestar de la comunidad? Utiliza nuestra plantilla prediseñada de Objetivos de Desarrollo Sostenible (ODS) ODS 11 Ciudades y Comunidades que incorpora objetivos urbanos, indicadores y visuales de progreso de manera clara y profesional.
Esta plantilla PowerPoint ODS 11 contiene:
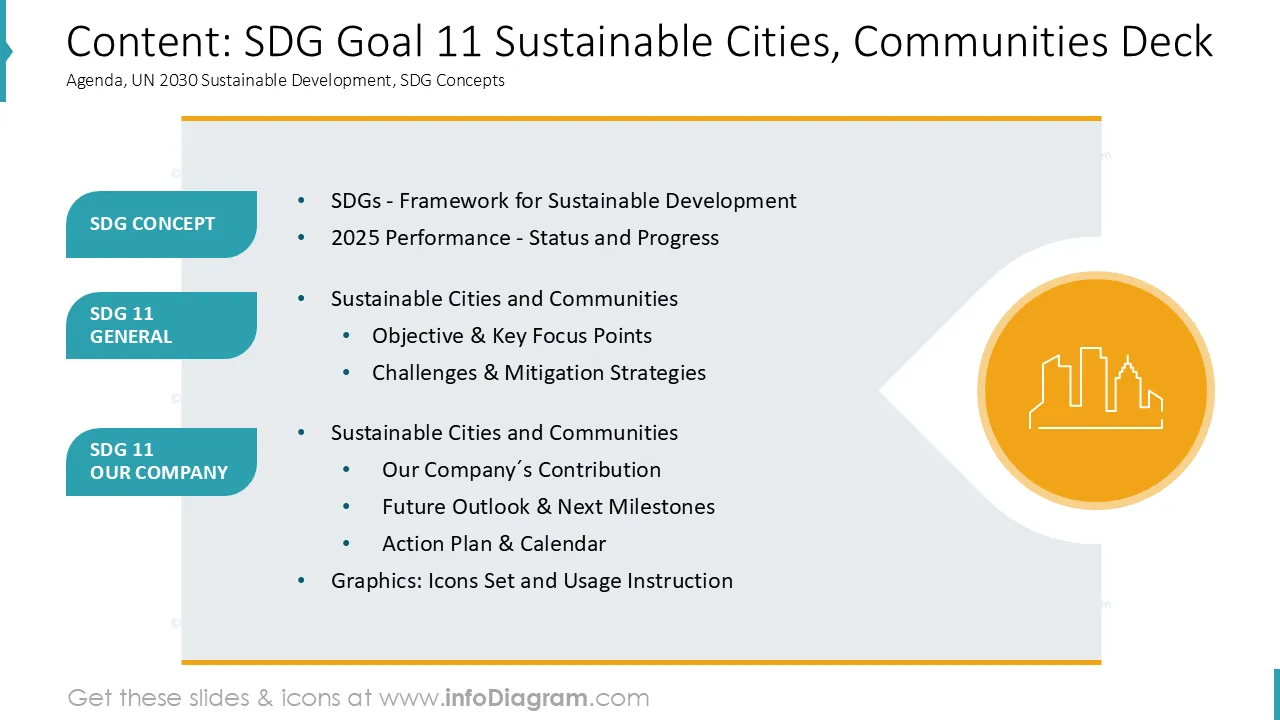
- 17 diseños con gráficos, tablas y diagramas que ilustran varios problemas relacionados con la vida urbana, la planificación, la vivienda, el transporte, los espacios públicos, la resiliencia ante desastres y varios tipos de temas comunitarios
- Más de 30 iconos que ilustran temas de sostenibilidad, los 17 objetivos ODS, Trabajo, Economía, Rendimiento, Finanzas, Plan, Estrategia, Personas, Energía limpia u otros conceptos de negocio generales
- Instrucciones sobre cómo modificar esos diagramas utilizando las herramientas de edición estándar de PowerPoint.
Esta plataforma de diapositivas PowerPoint está diseñada en un estilo profesional con coloridas ilustraciones vectoriales e iconos de línea. Todas las formas gráficas se pueden recolorear y redimensionar sin pérdida de calidad.
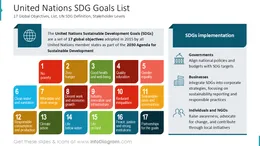
¿De qué trata el objetivo de sostenibilidad de la ONU 11 - Ciudades y Comunidades?
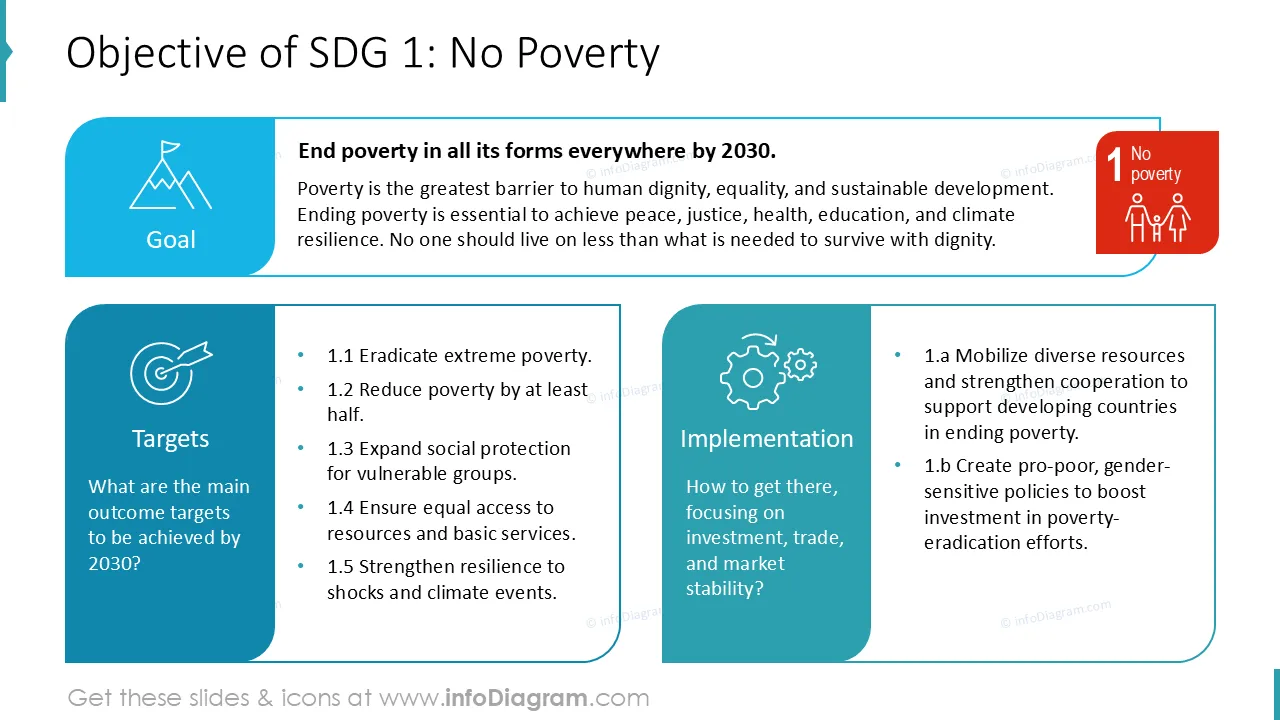
El ODS 11 es un Objetivo de Desarrollo Sostenible de las Naciones Unidas centrado en hacer que las ciudades y los asentamientos humanos sean inclusivos, seguros, resilientes y sostenibles. Cubre la planificación urbana, la vivienda, el transporte, los espacios públicos y la resiliencia ante desastres.
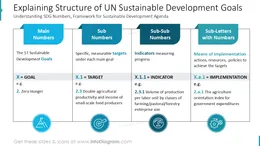
El ODS 11 define un marco estructurado para rastrear el rendimiento de la sostenibilidad urbana utilizando objetivos e indicadores definidos.
¿Por qué utilizar una forma visual para presentar Ciudades y Comunidades Sostenibles (ODS 11 de la ONU)?
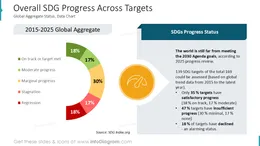
Los temas urbanos a menudo combinan datos sociales, ambientales y de infraestructura. Las diapositivas visuales ayudan a organizar indicadores complejos de la ciudad en mensajes claros.
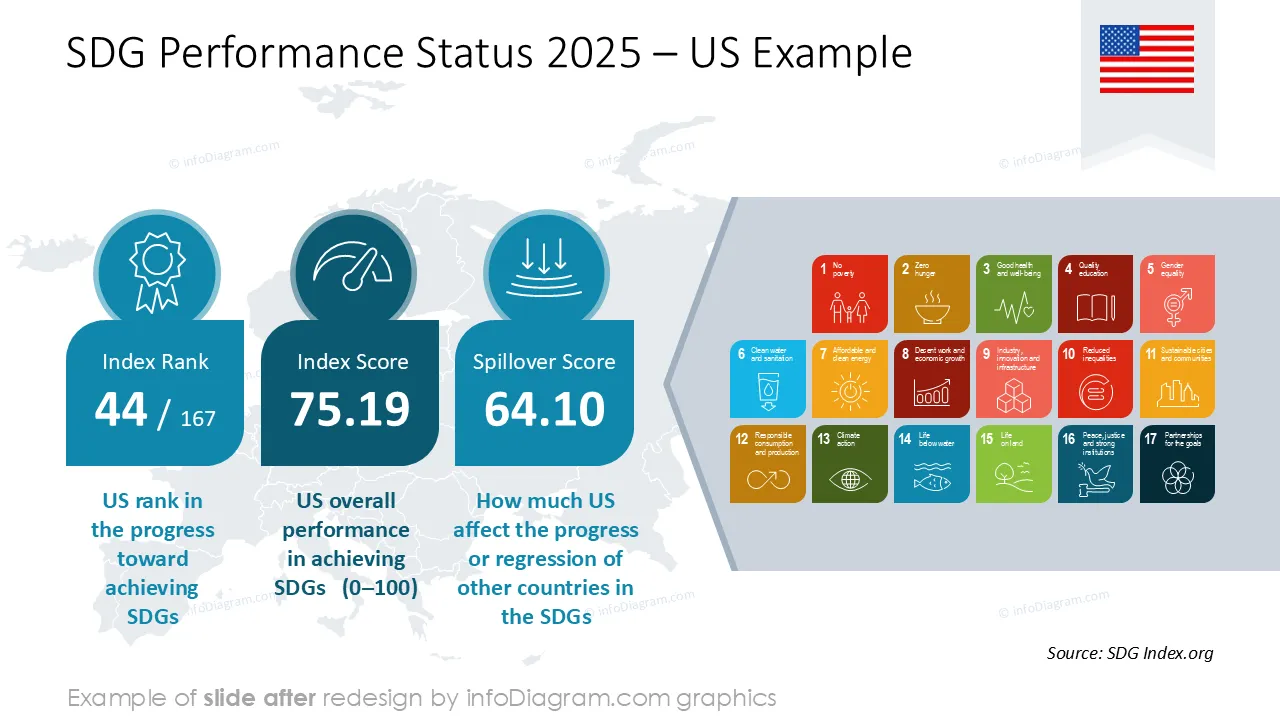
La visualización de información mediante el dibujo de diagramas, tablas y gráficos hace que esas tendencias de sostenibilidad, riesgos y progreso sean más fáciles de explicar. Presentarlos en diseños estructurados apoya el compromiso mediante la narrativa en torno a la habitabilidad y la resiliencia.
Tener una plantilla de PowerPoint consistente como base mantiene el mensaje alineado. Las imágenes prefabricadas ahorran tiempo y mejoran la claridad en los informes urbanos.
Estas plantillas de PowerPoint de ODS prediseñadas le permiten reutilizar nuestras ilustraciones. Todas las formas y textos son editables. También incluimos instrucciones sobre cómo editar colores y estilo.
¿Cómo puedes utilizar los elementos visuales de PowerPoint del ODS 11 Ciudades y Comunidades?
Algunos ejemplos en los que puedes utilizar esta plantilla de presentación de ODS:
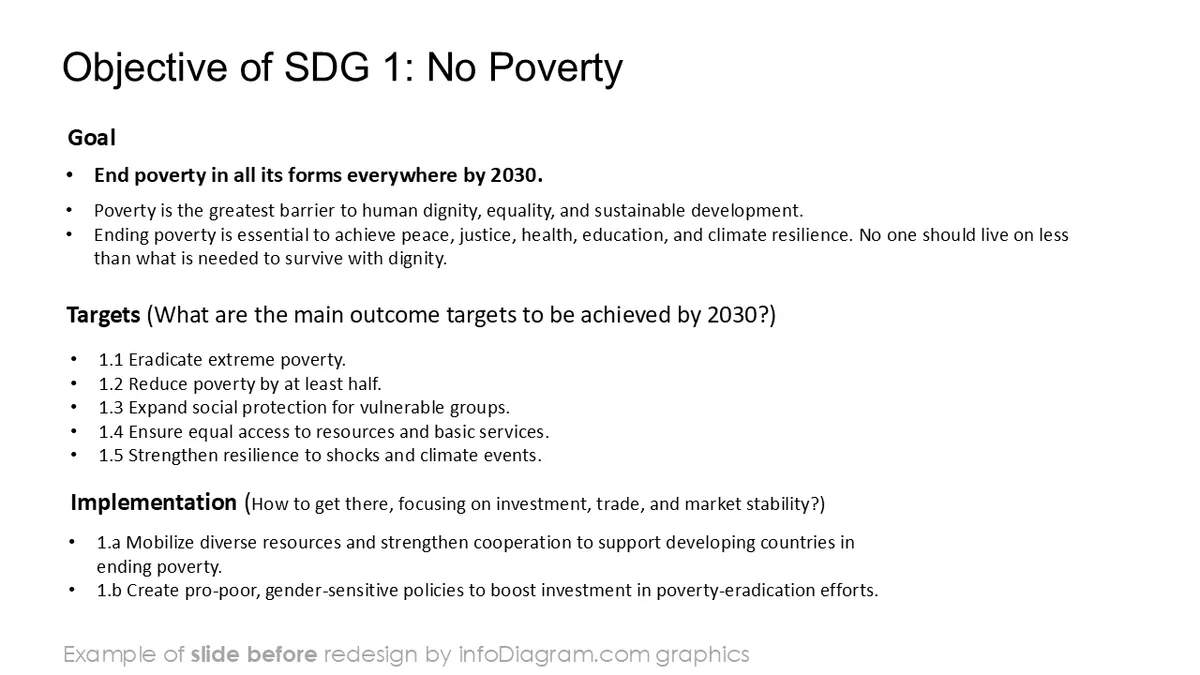
- Introducir los objetivos, metas e indicadores del ODS 11 en un resumen conciso
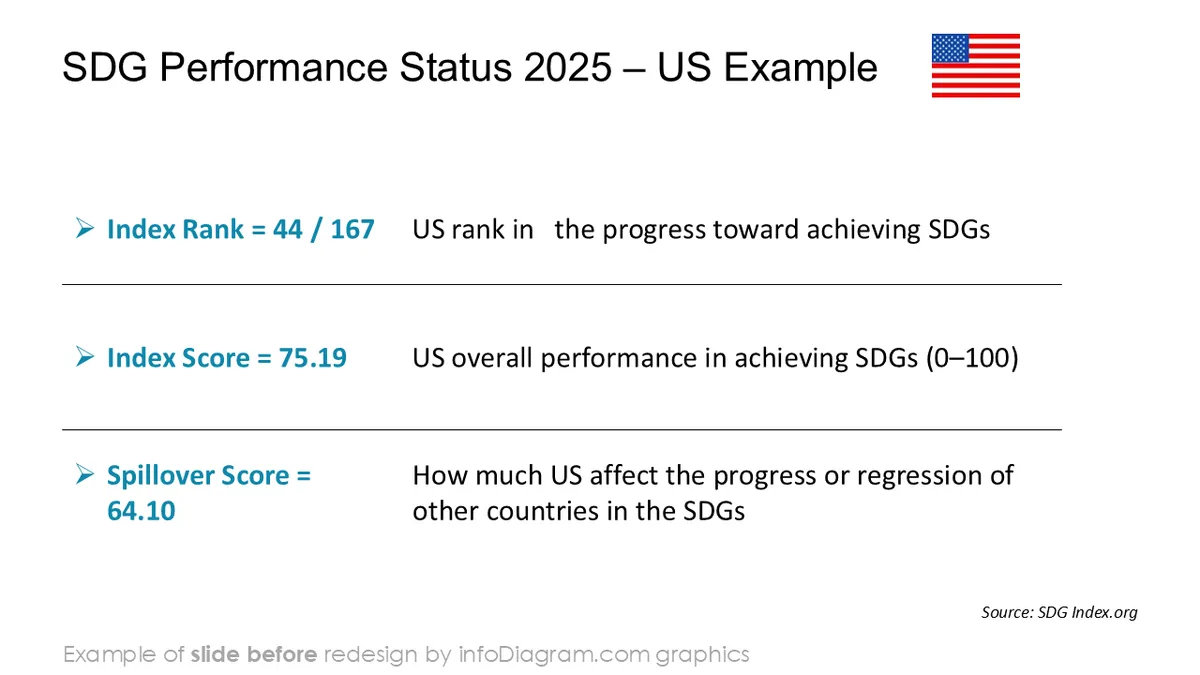
- Visualizar KPI urbanos como el acceso a la vivienda, el transporte y los espacios públicos
- Presentar iniciativas de ciudades inteligentes, resiliencia y desarrollo comunitario
- Apoyar informes ESG, de sostenibilidad o de impacto climático con diapositivas centradas en la ciudad
- Comparar el rendimiento de la ciudad o la región en diferentes períodos de tiempo
- Destacar riesgos, brechas y acciones prioritarias con marcadores de estado visuales
Todos los gráficos son editables para modificar el tamaño, los colores y el texto. Además, puede ampliar aún más la colección con símbolos PPT adicionales (consulte la sección Diagramas relacionados).
Puedes modificar fácilmente todos los elementos:
- Reemplazar iconos
- Cambiar el color del relleno y del contorno
- Modificar el tamaño y las proporciones
- Rotar, voltear, alinear y cambiar el orden
Autores de esta plantilla de presentación de los ODS