
Cover and narrative setup


Deck preview
This template does not have a dedicated before/after case study, so we show the strongest slides from the actual deck instead.
Cover and narrative setup
Core structure and talking points
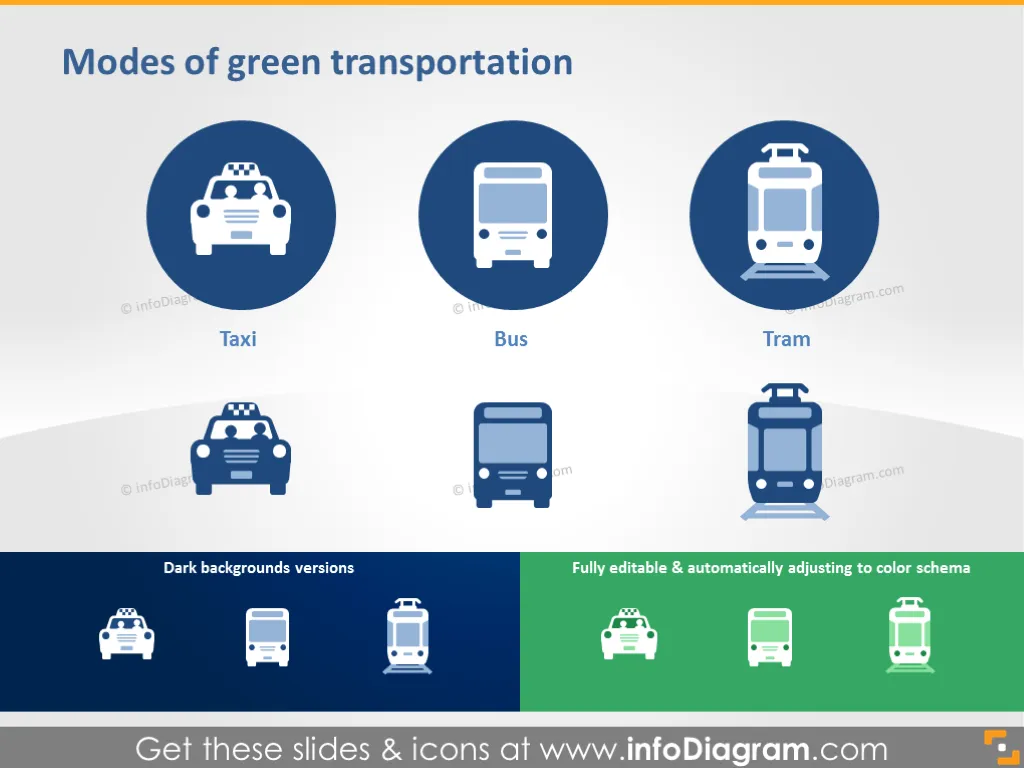
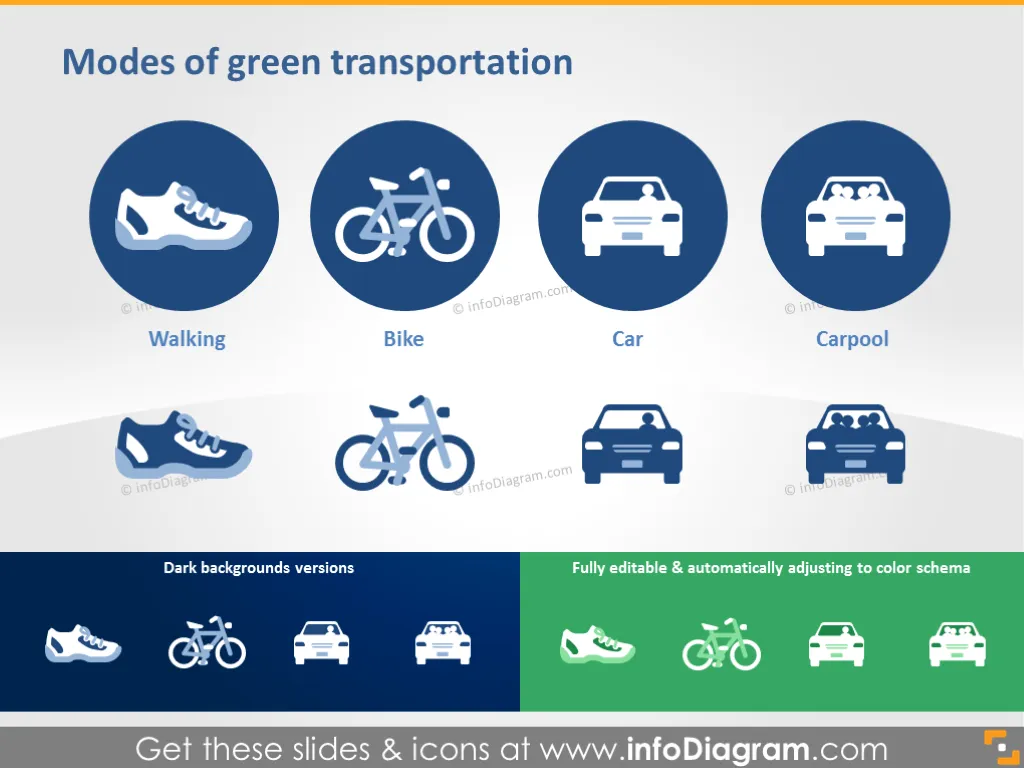
Polished visual slide from the deck
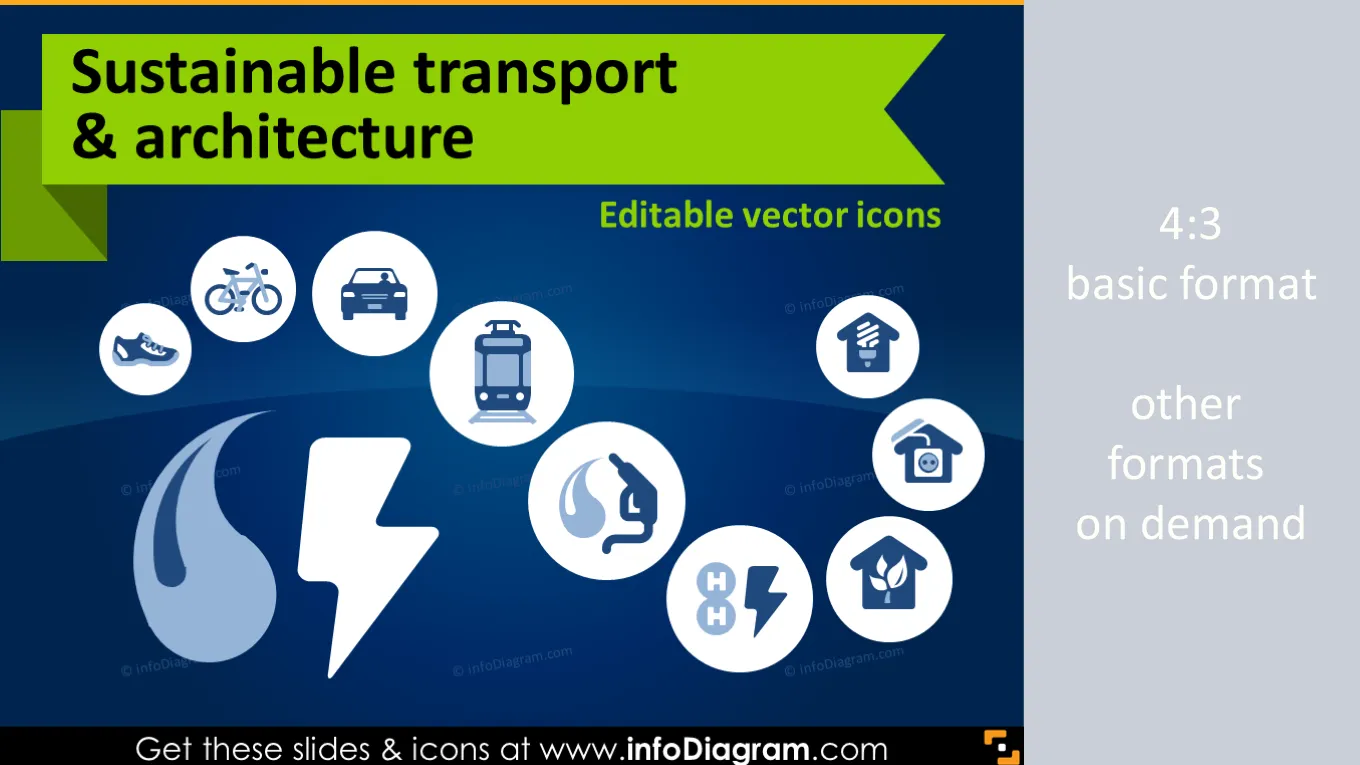
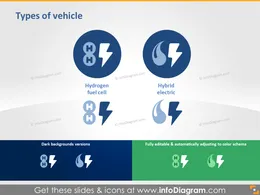
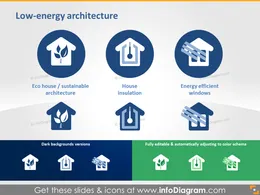
Sustainable Transport and Architecture - Ecology icons and visuals for sustainability related presentations.
Icons for visualizing ecology related topics. All symbols are as clipart pictures - fully editable in PowerPoint.
Package content:
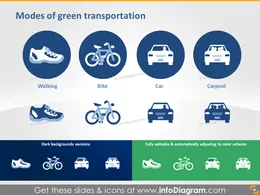
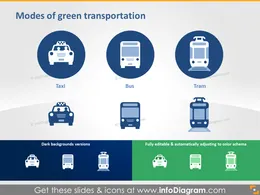
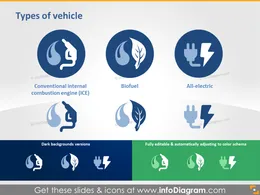
All icons in simple flat style, suitable for Metro UI style graphics.. Icons provided in 4 versions:
Fully editable in PowerPoint set of vector shapes fully editable by using built-in PowerPoint tools, including
See editing demonstration in our HowTo Videos.
Ihre Grafiken verleihen meinen Präsentationen eine nette Note, und ich habe sie kürzlich für eines meiner All-Hands-Meetings verwendet. Ihre Toolbox verleiht meinen Folien Professionalität, anstatt Standard-Clipart zu verwenden.
Claude Jones, Leiter Entwicklung, @Walmartlabs, USA
Ich brauchte einen neuen Blick auf einige meiner Folien. Ich habe versucht, einen Weg zu finden, einen Pinselschlag-Effekt zu erzielen, um zu unterstreichen, hervorzuheben, Farbe hinzuzufügen, und die handgeschriebenen Markierungen waren genau das Richtige. Sehr einfach zu bedienen, leicht in der Größe zu ändern, die Farbe zu ändern. Es war eine erschwingliche, perfekte Lösung und ich empfehle sie gerne weiter.
Anonymous, US
Die klare, saubere Optik der Grafiken und die Tatsache, dass ich die Farben leicht bearbeiten und an die Vorlage anpassen konnte, war mein Hauptgrund für den Kauf.
Brandie Jenkins, E-Learning-Entwickler, USA


You may also need