infoDiagram >
Content-ready Topics >
Supply Chain >
Supply Chain and Logistics Visuals Toolbox (PPT icons)
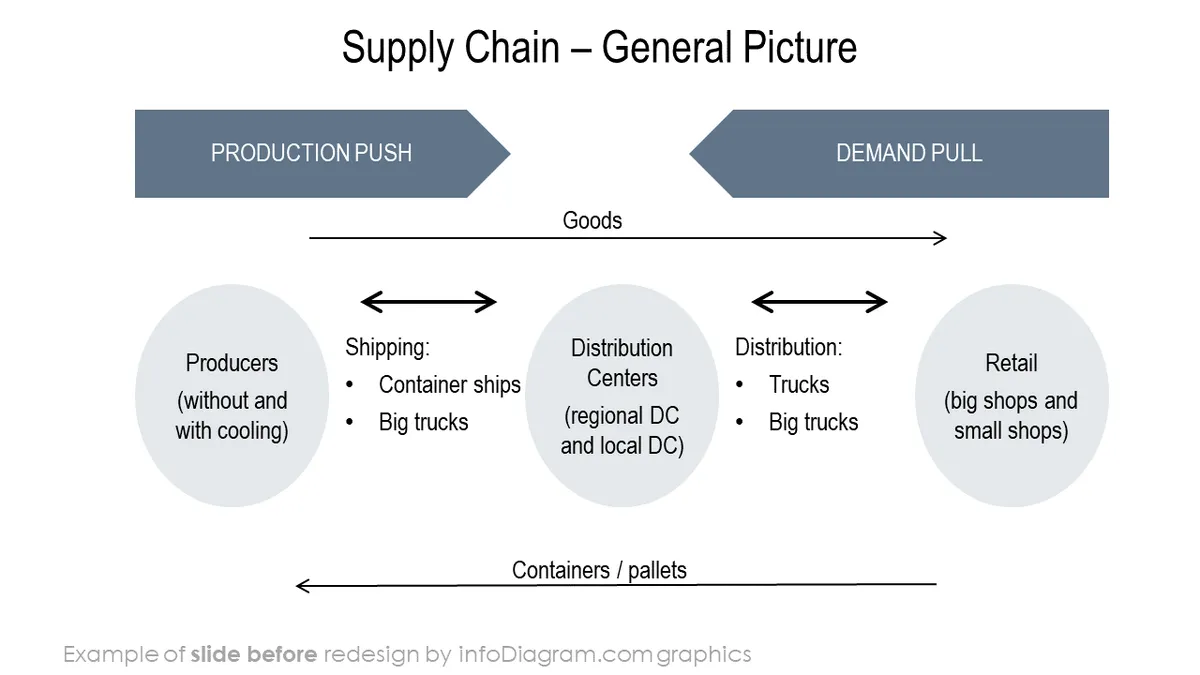
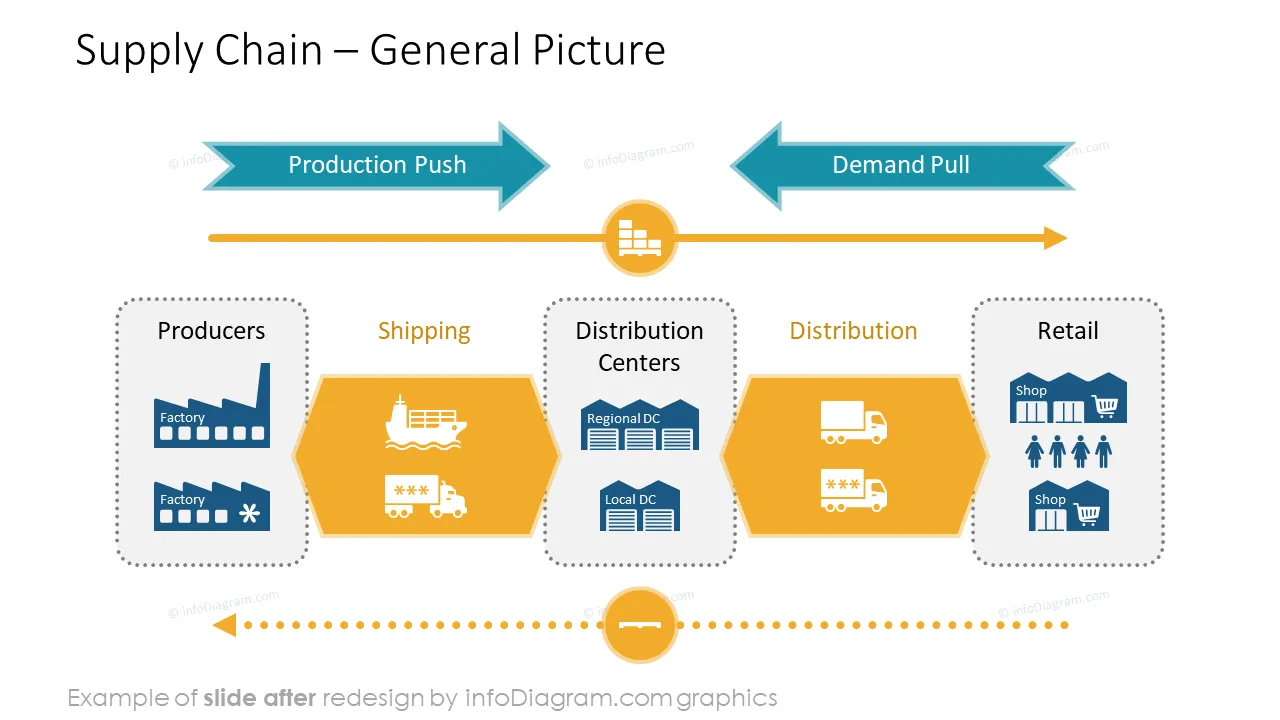
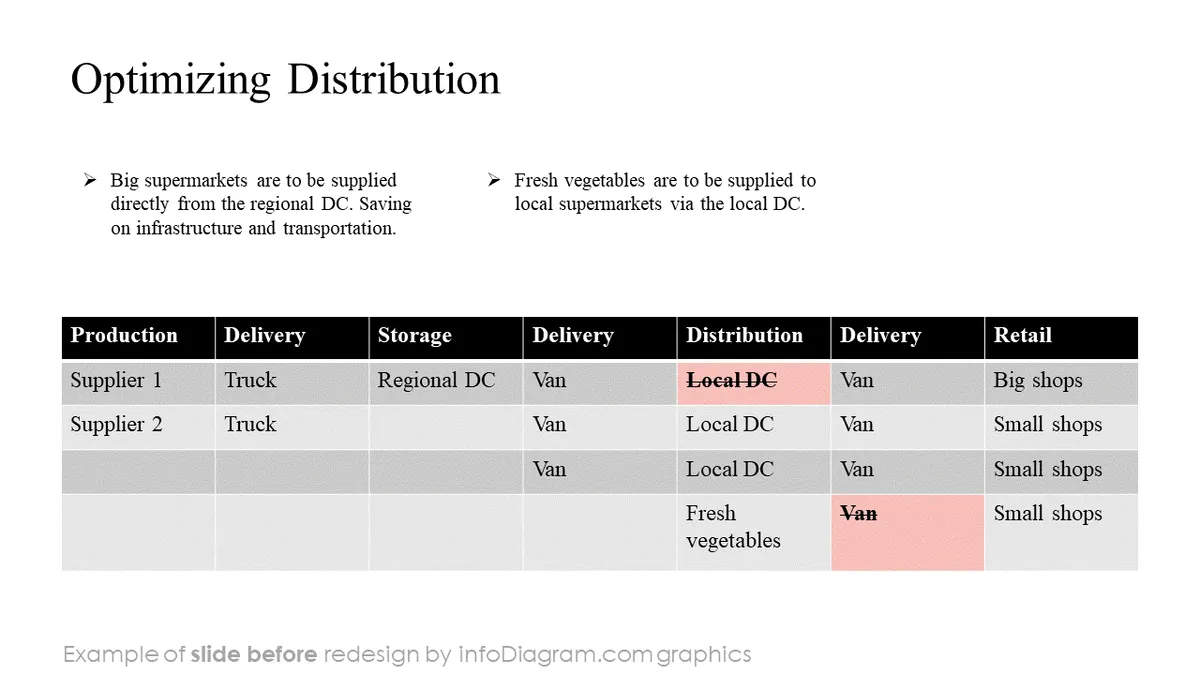
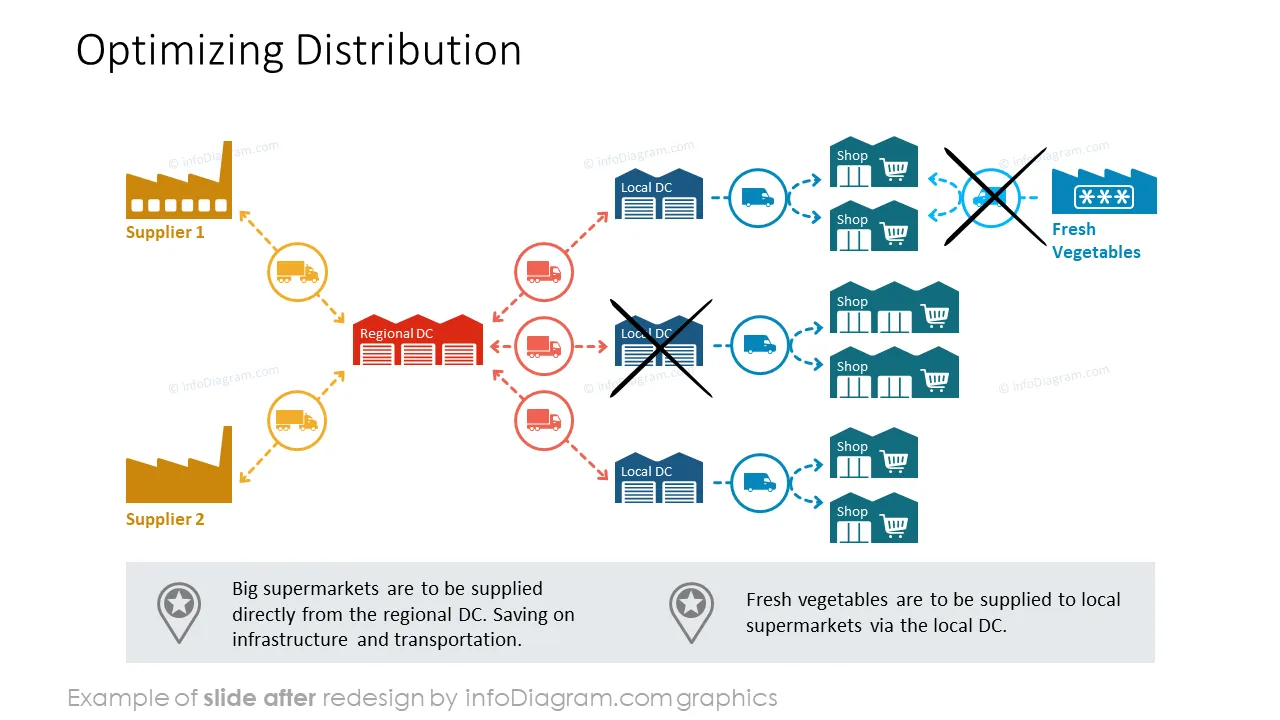
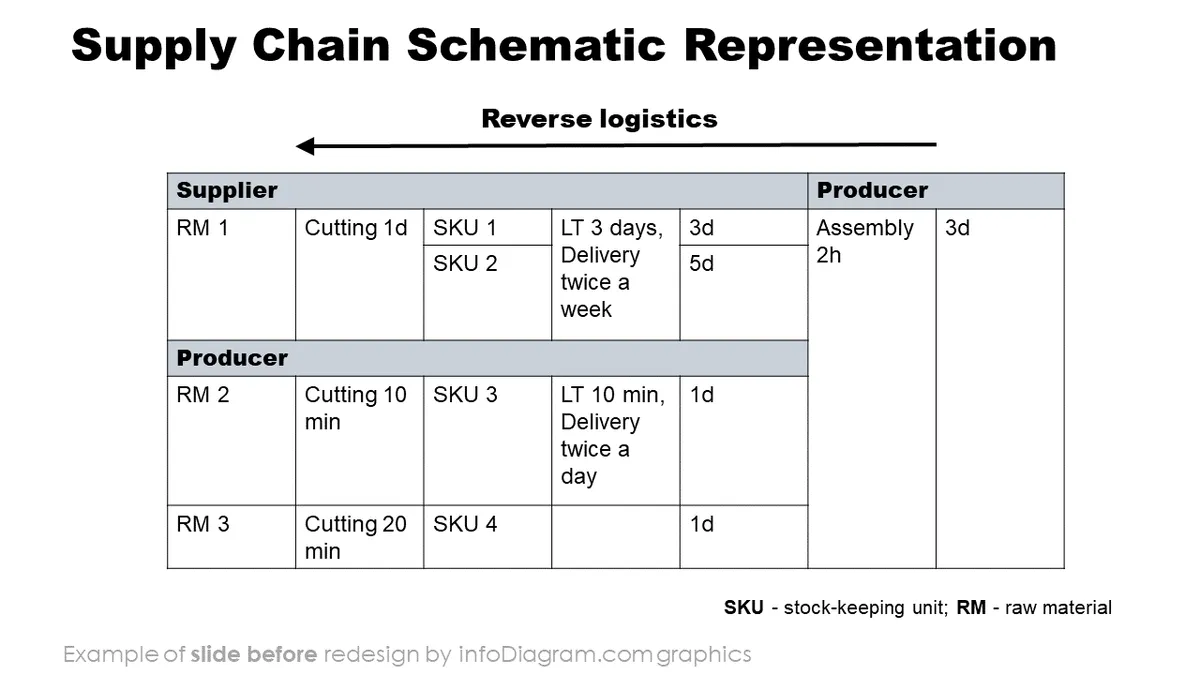
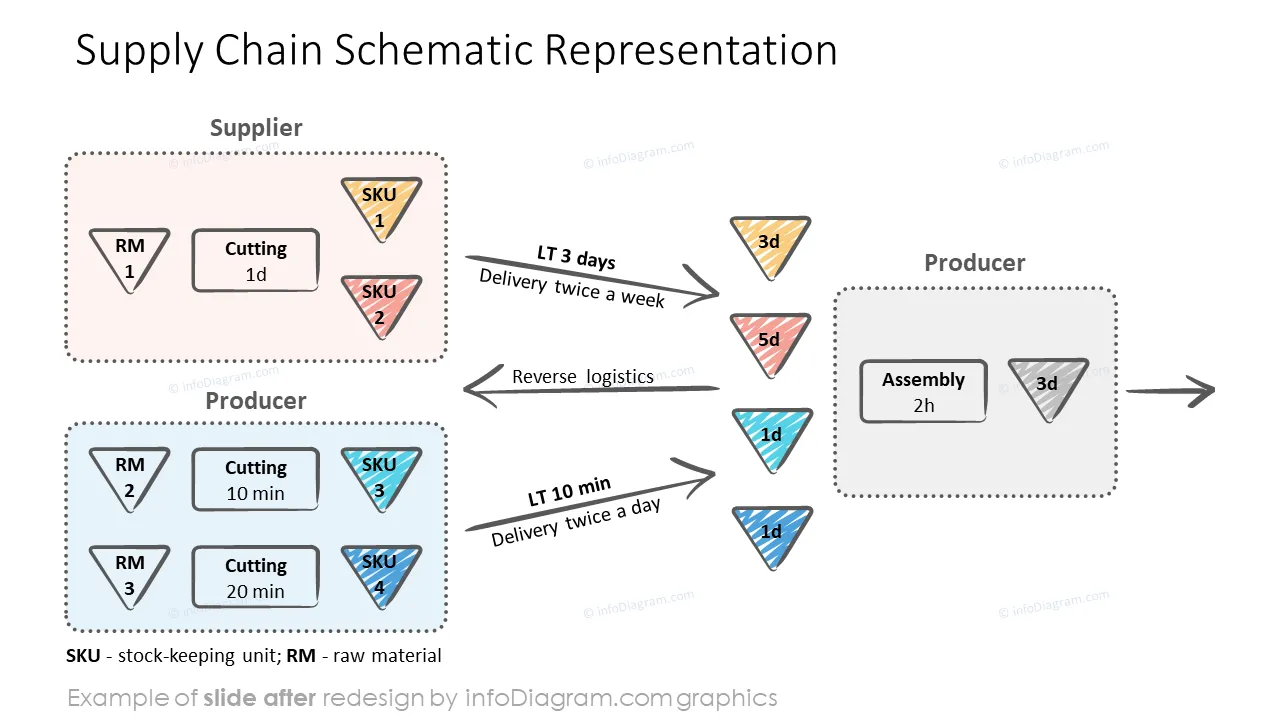
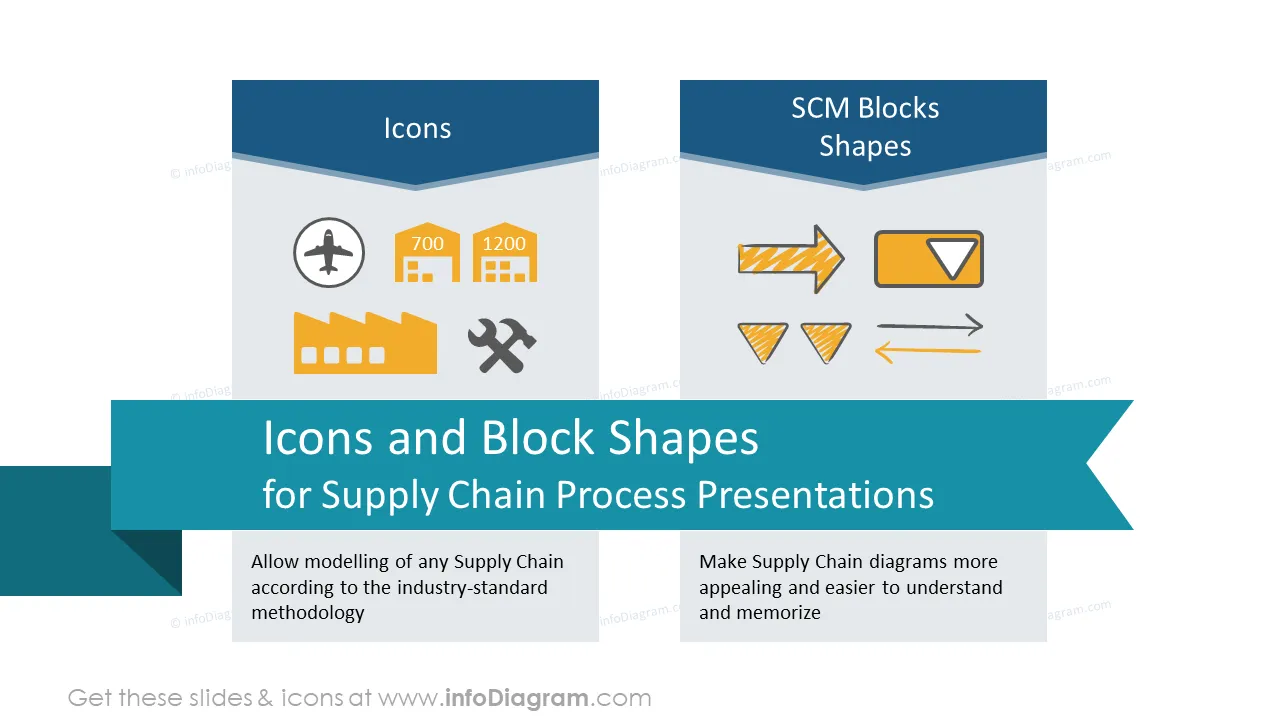
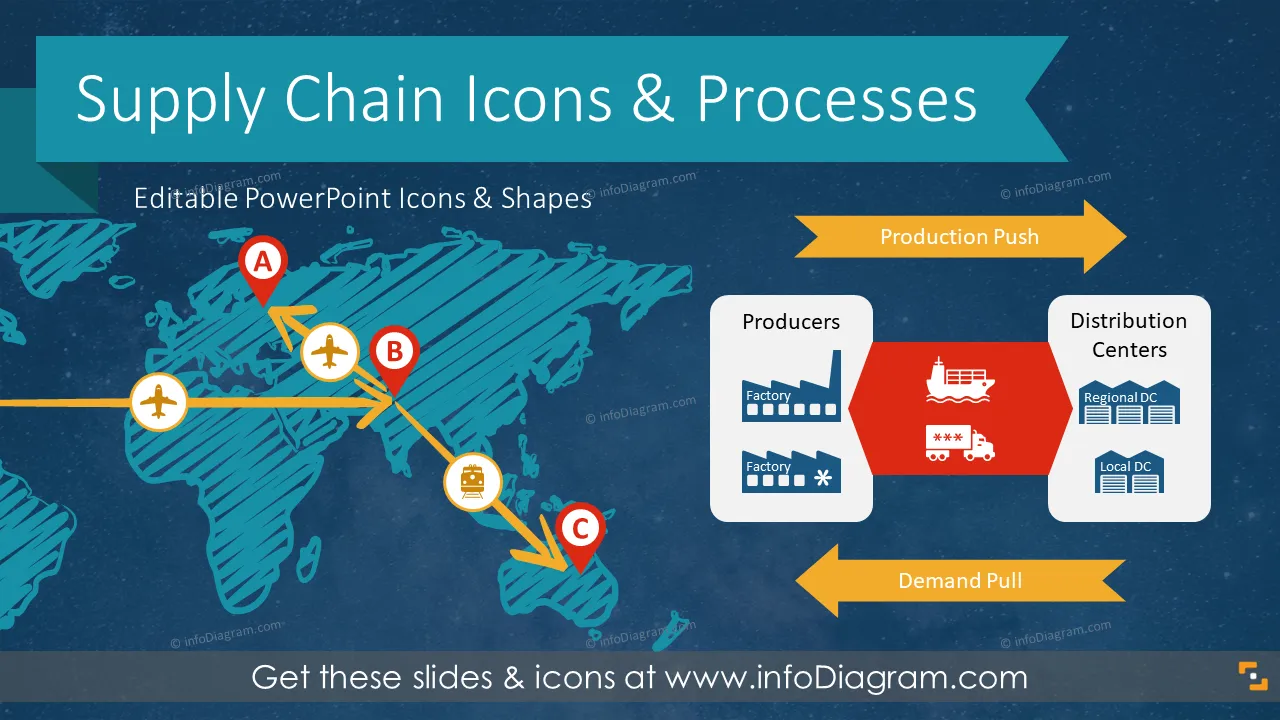
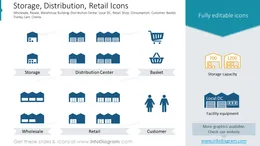
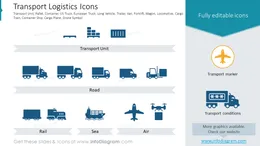
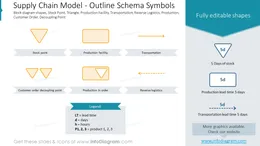
Supply Chain and Logistics schema diagrams & pictogram icons - editable graphical elements for PowerPoint
- 42 SCM pictograms (factories, transport, distribution, stores, maps)
- 37 schematic shapes for modelling any Supply Chain according to the industry-standard methodology
- 2 graphical styles: free handwritten style and gradient
- 4 reallife supply chain management examples
- format: fully adaptable vector shapes (color, filling, size)
Editable Supply Chain and Logistics shapes and pictograms
Content:
- to visualize supply chain management concepts, from different production facilities, through stocks and distribution centers, various transport means, finishing retail stores
- to illustrate distribution flows
- to model any supply chain using formal standard methodology
Content:
79 supply chain graphical elements:
- pictograms of production facility, factory, producer, supplier, production facility with cooling processes
- symbol icons of cooling, production process, assembly, packaging
- pictograms of storage and storage with cooling, Distribution Centre DC (big, small, DC with cooling), Wholesale (with cooling), Retail, shop (big, small), consumption
- symbols of transport by truck (long vehicle, small lorry, with cooling), train (railway transport), plane (air transport), ship (sea transport), pallets
- handwritten schema shapes for supply chain diagrams (SCM flow charts): stock point, production, production on order, X days on stock, production lead time
- handwritten arrow shapes for SCM flow diagrams representing: Transportation, Goods flow, Reverse goods flow, Reverse logistics, Information flow (electric), Information flow (manual), production push, demand pull directions, Customer Order Decoupling Point, production on order
- two graphic styles of SCM elements: gradient style and hand drawn scribble style
-
Real-life supply chain examples:
- Supply Chain - general picture of related logistics
- Optimizing distribution ( Big supermarkets to be supplied directly from the regional DC. Saving on the infrastructure and transportation. Fresh vegetable to be supplied to local supermarkets via the local DC. )
- Overview of a European Supply Chain ( illustrating not competetive costs of production in Belgium, Increase in demand requiring opening a new production facility in China, increasing throughput in Turkish production facility, moving of Belgian production to Turkey and China. Increasing size of the DC in Poland and in Turkey).
- Supply Chain Schematic Representation with a supplier, two producers, reduction of WIP ( reverse logistics, SKU - stock keeping unit, RM - raw material, WIP - work in process )
About Supply Chain methodology and Logistics
Definitions- What's Supply Chain Management ( Wikipedia )
- What is Supply Chain Design: APICS
- Links to Supply Chain Forums
- SCM - Supply Chain Management ( Wikipedia )
- Reverse Logistics ( Wikipedia )
- LT - Lead Time ( Wikipedia )
- WIP - Work in process ( Wikipedia )
- DC - Distribution Center
- SKU - Stock Keeping Unit
- RM - Raw Material
- changing contour color of the puzzle elements
- changing color of gradient or scribble filling
- adding shadows
- changing shape and size, rotating, flipping the object
- putting shapes behind or on top of text
Authors
- Know-how: Aneta Blaszczyk, SCM specialist
- Design: Peter Zvirinsky, Prezentio.com designer , Contact: here
How to edit text & colors

How to expand / shorten diagram

How to Replace Icons in infoDiagram PPT
